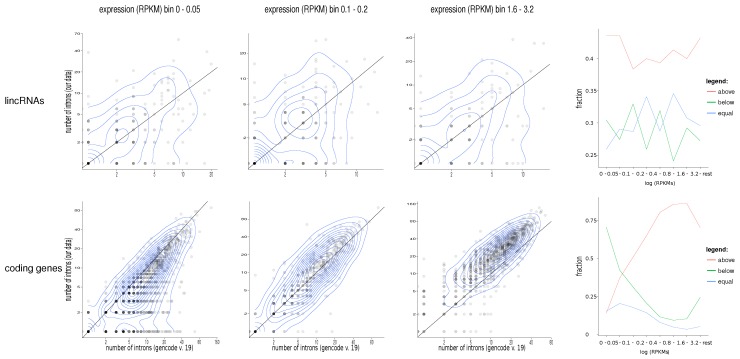
Figure 2.
Scatterplots for different numbers of expression bins for long intergenic non-coding RNAs (lincRNAs) and coding genes. The diagonal, where , is marked by a line. Points above the line are those genes for which we calculate more introns compared to GENCODE v.19. Only genes with at least one intron supported by at least 10 reads are considered here. The right-most column displays the fraction of genes that show more (red), the same (blue), or fewer (green) distinct splice junctions in the lymphoma data compared to GENCODE v.19. For the coding genes, there is a clear dependence of these fractions on the expression level: for highly expressed mRNAs, we systematically predict more (rare) splice variants. For mRNAs that are very lowly expressed in the lymphoma data set, GENCODE v.19 has more complex gene models. Overall, there are still more introns in our data set than annotated (Wilcoxon test ). In contrast, we systematically see more introns in lincRNAs than annotated by GENCODE (Wilcoxon test ), independent of the expression level. An alternative presentation of the r.h.s. panels showing data binned in 5-percentiles can be found in the Supplementary Material. RPKM: reads per kilobase and million reads.

