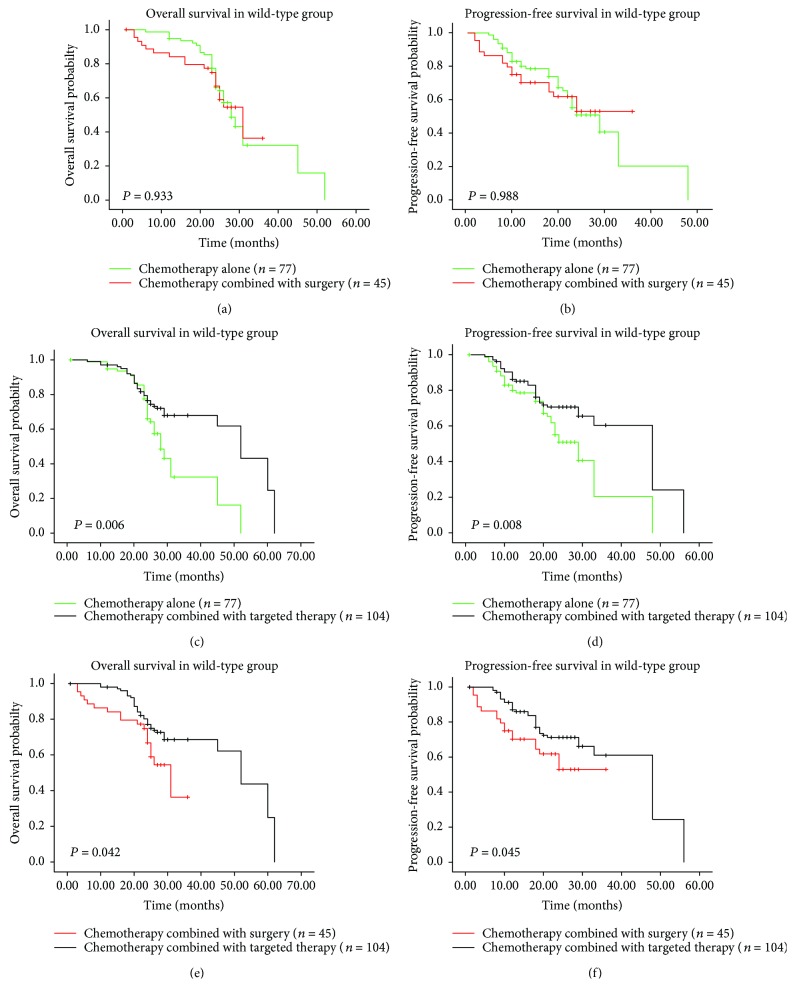
Figure 6.
Kaplan-Meier survival curves of wild-type group stratified according to treatment regimens. (a) OS and (b) PFS chemotherapy alone versus chemotherapy combined with surgery, (c) OS and (d) PFS chemotherapy alone versus chemotherapy combined with targeted therapy, and (e) OS and (f) PFS chemotherapy combined with surgery versus chemotherapy combined with targeted therapy. OS: overall survival; PFS: progression-free survival.

