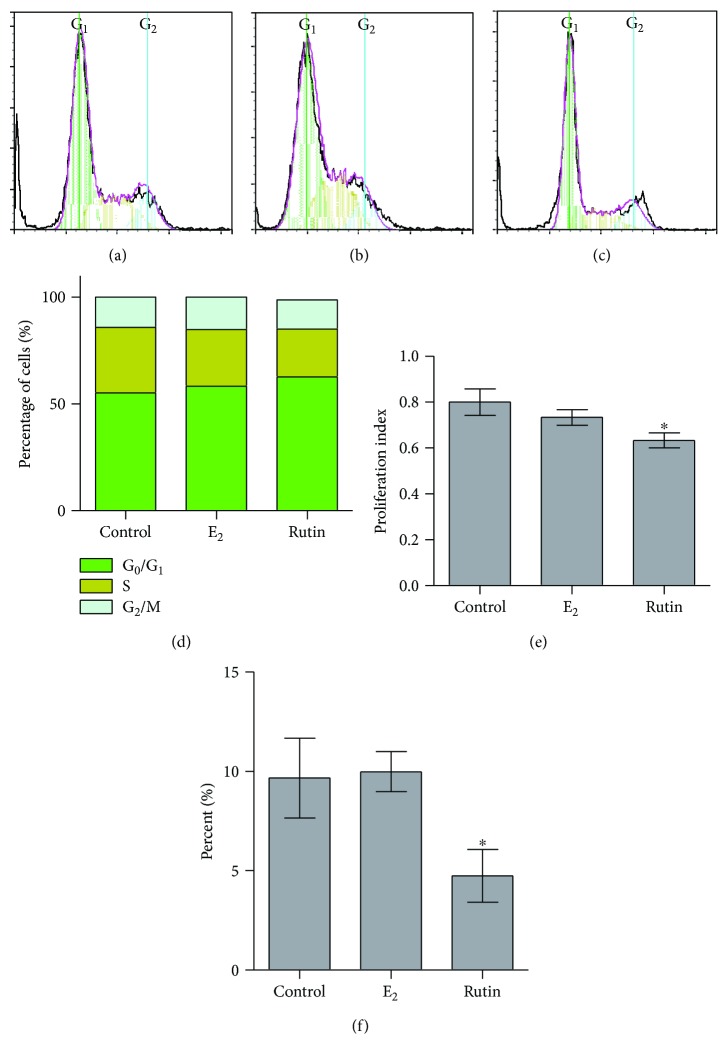
Figure 2.
Effect of rutin on the cell cycle distribution of SAOS-2 cells. Cells were exposed to rutin (1 μM) for 48 h (b) and compared to control untreated cells (a) and E2- (0.1 μM) treated cells (c). Cell cycle distribution was determined using DNA cytometry analysis and different cell phases were plotted (d) as percentage of total events. Proliferation index was calculated and plotted (e). Supra-G2/M cell population was plotted as percent of total events (f). Data are presented as mean ± SD; n = 3. ∗Significantly different from the control untreated cells; p < 0.05.

