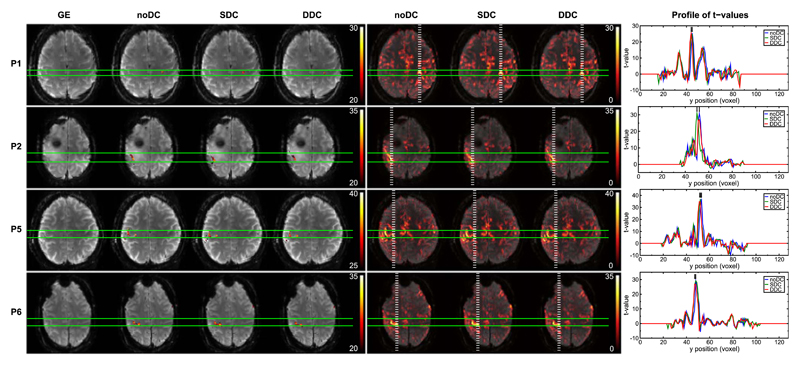
Fig. 3.
Comparison of noDC, SDC, and DDC for 4 patients. Patients P3 and P4 are illustrated in a dedicated figure (Fig. 5). Potentially clinical relevant shifts were found in these two cases and are described in Section 3.2.1. Left column: GE reference and thresholded activation maps obtained from noDC, SDC, and DDC analyses. Middle column: Unthresholded positive t-values for noDC, SDC, and DDC. Images are presented with a transparency of 25%. Right column: Plots of the t-values for noDC (blue), SDC (green), and DDC (red) along the dashed white lines (in posterior-anterior direction) on the full range maps of activation (middle column). Images are presented in radiological convention.

