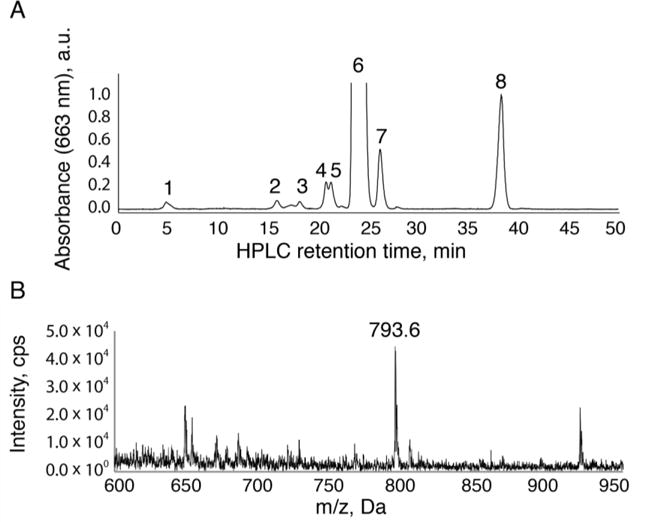
Figure 3.

HPLC elution profile of methanol extracted pigments from PSII purified from T. elongatus in normal growth conditions (55 °C). The HPLC chromatogram in (A) represents a single representative experiment from over 3 repetitions. Peak 1 is the previously unidentified Chl a with a farnesyl tail with a demetallated mass of 793.6 m/z and its mass spectrometry analysis can be seen in (B). Peaks 2-5 represent Chl a with the phytyl tail that has not been fully reduced from geranylgeranyl and Chl a with oxidized headgroups. Peak 6 is Chl a. Peak 7 is Chl a′ (demonstrating a small contamination of PSI in this sample). Peak 8 is pheophytin. All peaks 1-6 have a QY absorption maximum at 663 nm, consistent with Chl a headgroup in methanol.
