
Figure 2.
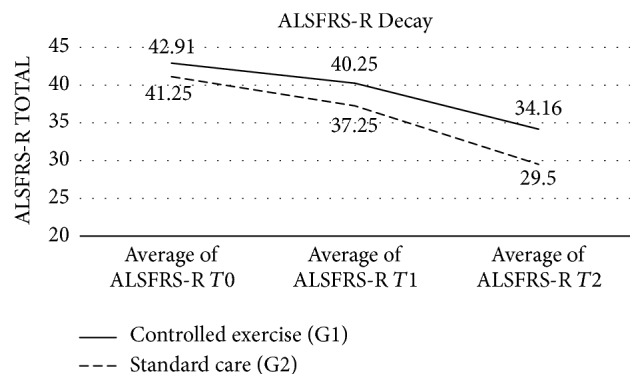
Slope of ALSFRS-R total score between T0, T1, and T2 for both groups.
Official websites use .gov
A
.gov website belongs to an official
government organization in the United States.
Secure .gov websites use HTTPS
A lock (
) or https:// means you've safely
connected to the .gov website. Share sensitive
information only on official, secure websites.
Slope of ALSFRS-R total score between T0, T1, and T2 for both groups.