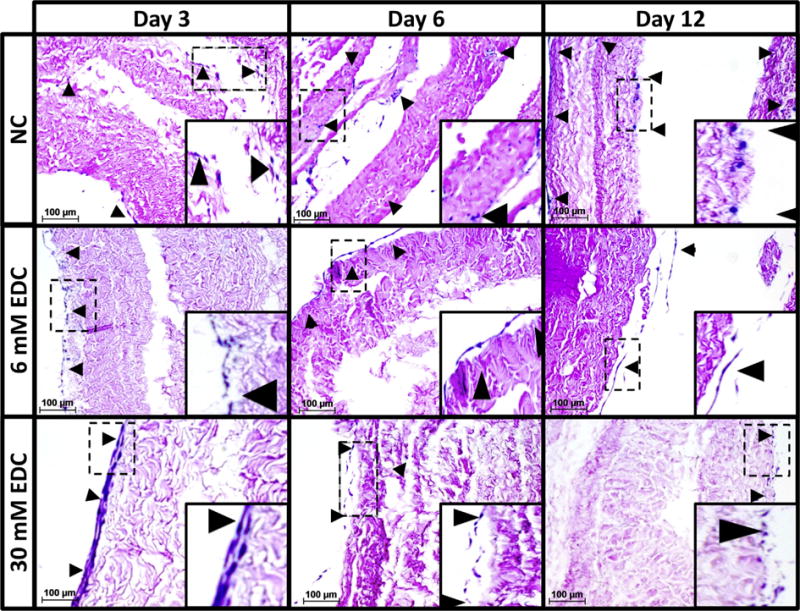
Fig. 7.

Cell infiltration in crosslinked AFRPS. Representative H&E images (200×) of non-crosslinked, 6 mM EDC, and 30 mM EDC AFRPs following cell seeding. Crosslinked samples illustrate minimal cell infiltration into AFRPs in contrast to non-crosslinked samples at respective time points (Insert: Magnified image highlighting representative region of interest outlined by dotted-line). (Black arrow head indicates cell nuclei). (Methods used to generate data within this figure are described in section 2.6.4).
