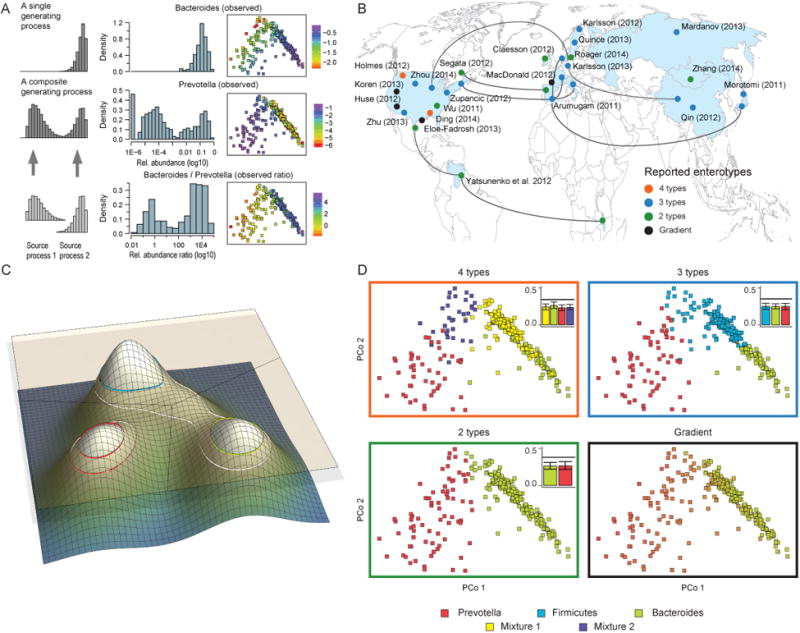
Figure 2. Stratification of the microbial composition landscape of the human gut microbiome.

(A) Abundance distributions of prevalent microbial genera of the human gut are often complex. Theoretical beta distributions (left panels) were compared with observed distributions (middle panel) and the observed abundance plotted in enterotype space (right panel) of key enterotype tax a or ratios thereof, based on 278 MetaHIT samples6. While Bacteroides abundance distribution is close to log-normal in the three large-scale datasets studied, that of Prevotella is bimodal, suggesting that the observed values are perhaps better explained by a mixture of two distributions, generated by two distinct processes, one of which corresponds to a dominating role in the community, while the other to a low abundance state.
(B) Geographical distribution of studies that report enterotypes (Suppl. Table 1), colored according to the number of microbial clusters reported. Map locations indicate the country from which samples were collected. Links between locations represent samples belonging to a single study. Overrepresentation of “Western” countries is a well-known bias and probably misses a portion of variation in other human societies.
(C) Schematic representation of the simulated microbial composition landscape with three density peaks, modeled as multivariate normal distributions, each representing an enterotype and drawn out of scale to make the concept more accessible. This figure illustrates how segmentation of this space by clustering with different parameters would result indifferent numbers of clusters (three and two here) and in differential coverage of individuals (represented by intersecting planes). Top-most overlay presents the discretizing segmentation, which splits the space into three zones.
(D) Projection onto a set of 278 Danish samples6 of the three most frequent enterotype classification schemes based on different methods, including the Prevotella/Bacteroides gradient. This shows a split into a gradient and two, three (distance based clustering) or four enterotypes (Dirichlet multinomial mixture models). The local structure is preserved regardless of the method applied, and Prevotella (ET P) remains separated, suggesting the methods mostly differ in dividing the area between ET B and ET F. Additionally, the top right of each PCoA with a number of clusters greater than or equal to two shows the distance within a cluster (colored accordingly) compared to the median distance between the clusters (black line), showing that for all cases the distances within are smaller than between; bar height is the median distance and the whiskers represent the 25th and 75th quantile. It should be noted that a “horseshoe effect” can occur in ordinations, in particular if samples contain non-overlapping compositions84, which is not the case in the datasets analyzed here.
