Figure 1.

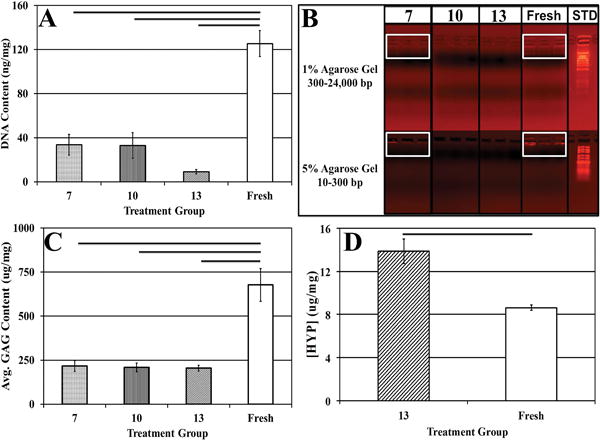
(A) DNA quantification demonstrating significant reductions in DNA content after decellularization as compared to fresh bovine NP tissue. (B) Agarose gel electrophoresis depicting the presence of intact DNA in fresh bovine NP and in treatment group 7 indicated in white boxes, and the lack of DNA fragments in treatment groups 10 and 13. (C) GAG and (D) [HYP] content of fresh and decellularized bovine NP subjected to treatments 7, 10, and 13. Horizontal bars connecting groups indicate significant differences (p<0.05).
