Figure 1.
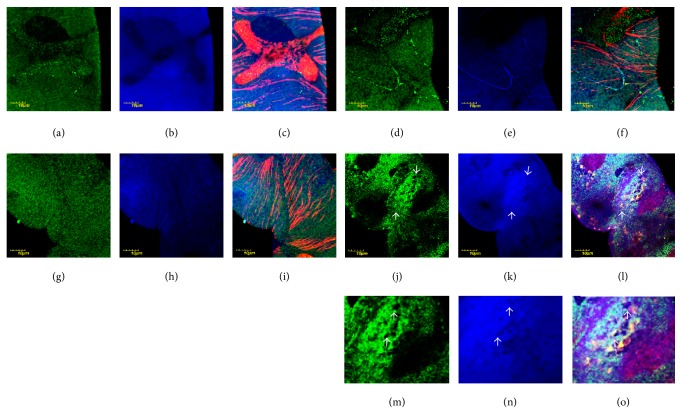
Protein nitration in Malpighian epithelial cells. Color code: mitochondria, green; nitrated proteins, blue; actin, red. (a) Wild-type flies incubated at 20°C, mitochondria, (b) nitrated proteins, and (c) merge. Note a stellate cell in (c). ((d), (e), (f)) Wild-type flies incubated at 29°C and displayed in the same order. ((g)–(i)) Mutant flies, incubated at 20°C, and ((j)–(l)) mutant flies, incubated at 29°C. Photomicrographs are displayed in the same order as in the upper row. Localization of nitrated proteins to mitochondria is shown in (c), (i), (f), and (l). Uneven distribution and fusion of mitochondria are demonstrated in (j). White arrows in (j), (k), and (l) pointing the region displayed in higher magnification in (m), (n), and (o). White arrows in (m), (n), and (o) showing regions with no/few mitochondria and the lack of staining, demonstrating localization to mitochondria with nitrated proteins indirectly.

