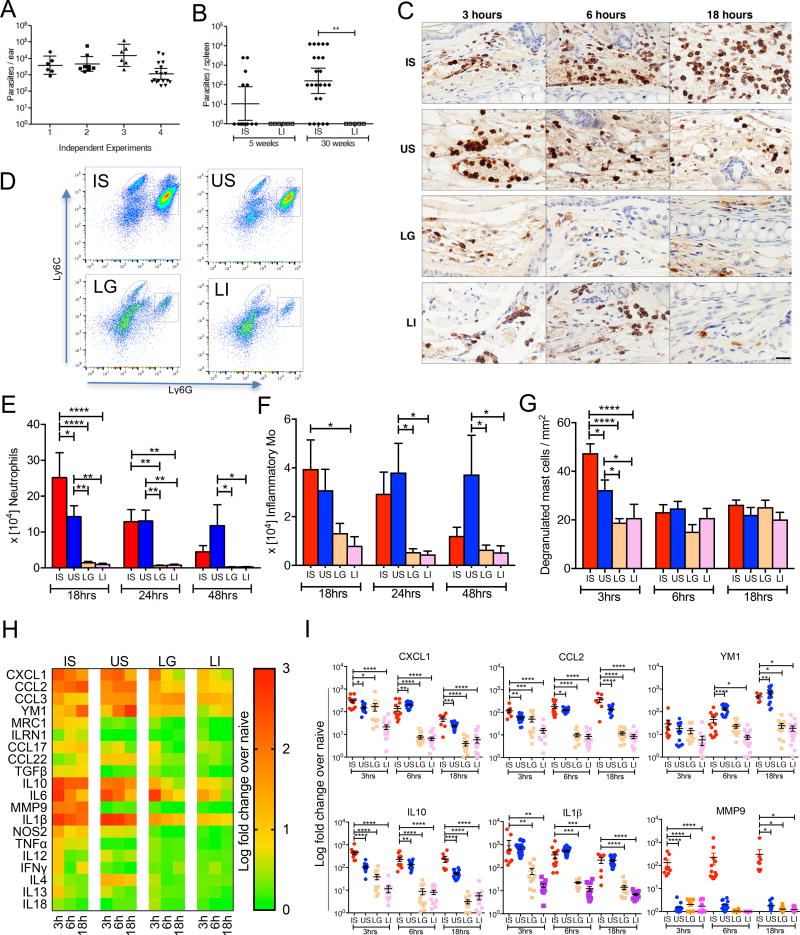
Figure 1. The inflammatory response at the bite site of vector-transmitted L. donovani parasites.
(A) Parasite burden determined by qPCR in individual mice ears 3h after exposure to 20 infected sand flies (n ≥ 6 mice ears per experiment).
(B) Parasite burden in individual mice spleens was determined by serial dilution at five and 30 weeks after exposure to 20 infected sand flies (IS) belonging to the same group or to an intradermal injection of 105 metacyclic parasites (LI). Data are pooled from two independent experiments (n ≥ 13 for IS, and ≥ 5 mice for LI).
(C–I) Mice ears 3–48h after exposure to 20 IS, 20 uninfected sand flies (US), intradermal co-inoculation with LI plus extract of one salivary gland (LG), and LI.
(C) Mice ear sections stained with anti-Gr1 antibody. Pictures are representative of four independent experiments (n ≥ 4 mice ears per condition per timepoint). Scale bar indicate 20µm.
(D–F) Cells recovered from individual mice ears were stained for flow cytometry. Data are representative of two independent experiments (n = 6 mice ears per condition per timepoint).
(D) Representative plots of Ly6G and Ly6C expression distinguish neutrophils (square gate) and inflammatory monocytes (oval gate) graphed in (E) and (F), respectively.
(G) Degranulated mast cells in at least six fields counted from ear sections stained with Toluidine blue. Data are representative of four independent experiments (n ≥ 5 mice ears per condition per timepoint).
(H and I) mRNA expression of inflammatory mediators produced in mice ears determined by qPCR. Data are pooled from more than three independent experiments (n ≥ 7 mice ears per condition per timepoint).
(H) Heat map of the global inflammatory skin response.
(I) Expression profile of distinct genes relevant to the inflammatory response after IS.
Statistical significance *P < 0.05; **P < 0.01; ***P < 0.001, ****P < 0.0001 was calculated using the Wilcoxon ranked sum test (A and B), the one-way ANOVA followed by a Holm-Sidak multiple comparisons test (E–G and I). Error bars in (A, B) indicate the geometric mean with 95% CI. Error bars in (E–G and I) indicate the mean ± SEM.
See also Figure S1, S2 and S3.

