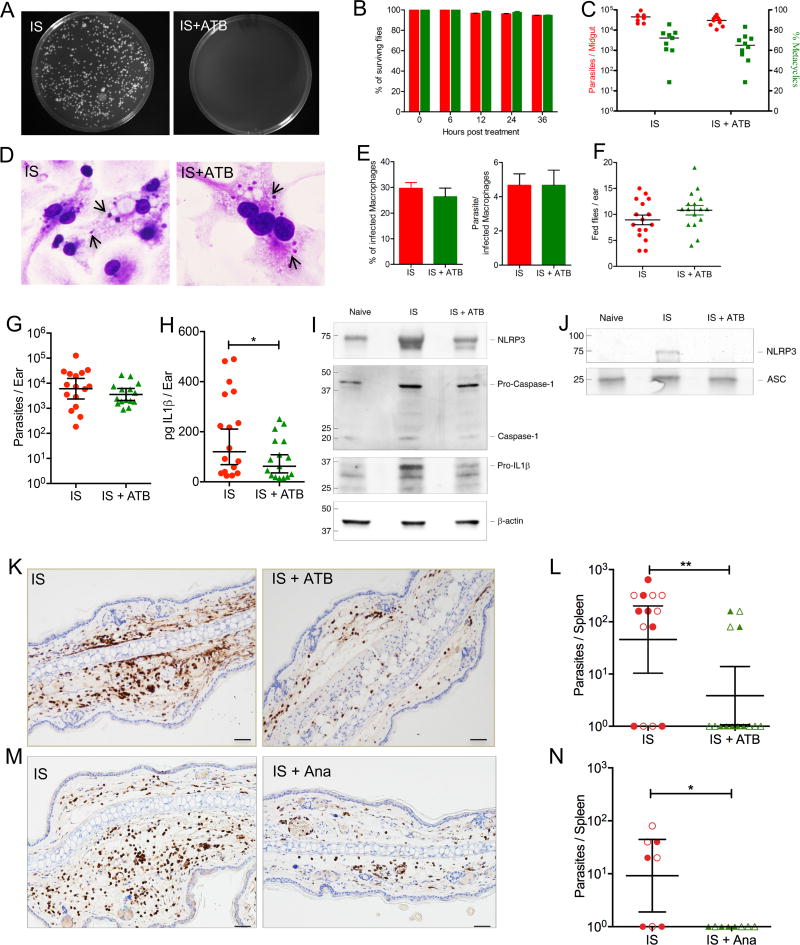
Figure 4. Diminishing sand fly gut microbiota mitigates inflammasome activation, abrogates neutrophil recruitment and compromises dissemination of Leishmania donovani.
(A–C and F–L) Sand flies harboring mature infections with L. donovani were left untreated (IS) or were provided a cocktail of three antibiotics for 36h prior to parasite transmission to mice ears (IS+ATB).
(A) Bacterial colony growth on LB/Agar after plating10 midguts.
(B) Survival of sand flies without (red) and after antibiotic treatment (green).
(C) Parasite burden and percent metacyclics in sand flies prior to transmission.
(A–C) Data are representative of four independent experiments (n ≥ 9 sand flies per condition per timepoint).
(D and E) In vitro invasion and multiplication of anterior gut residing parasites from IS or IS+ATB in bone marrow-derived macrophages (BMDM). Data are representative of two independent experiments.
(D) BMDM 48h after infection. Arrows indicate intracellular Leishmania amastigotes.
(E) Percent of infected BMDM and the number of parasites per cell.
(F) Feeding score after parasite transmission to mice ears. Data representative of four independent experiments (n = 16 sand flies per condition).
(G–J) Mice ear lysates after exposure to 20 IS or IS+ATB.
(G) Parasite burden determined by qPCR from individual mice ears 2h after bites.
(H) Ex-vivo IL1β protein levels measured by ELISA 6h after bites.
(G and H) Data are pooled from two independent experiments (n ≥ 15 mice ears per condition).
(I) Representative Western blot of NLRP3, Caspase 1 and IL1β protein levels (n = 2 mice ears per condition).
(J) Representative Western blot of NLRP3 protein levels after immunoprecipitation using anti-ASC antibody (n = 2 mice ears per condition).
(K and L) Mice ears were exposed to IS or IS+ATB.
(M and N) Mice were left untreated or were treated with anakinra 12h and immediately before exposure to IS (IS+Ana).
(K and M) Mice ear sections stained with anti-Gr1 antibody 6h after exposure to IS. Data are representative of two independent experiments (n = 4–5 mice ears per condition). Scale bars indicate 50µm.
(L and N) Parasite burden in spleens of individual mice determined by serial dilution three weeks after exposure to IS or IS+ATB. Data are pooled from two independent experiments distinguished by solid and clear symbols (n ≥ 8 mice per condition).
Statistical significance *P < 0.05, **P < 0.01was calculated using the unpaired two-tailed t test (H) and the Wilcoxon ranked sum test (L and N). Error bars indicate the geometric mean with 95% CI for parasite burden (C), (G), (L) and (N), and the mean ± SEM for (B), percent metacyclics (C), (E), (F) and (H).
See also Figure S4 and Table S1.

