
Figure 3.
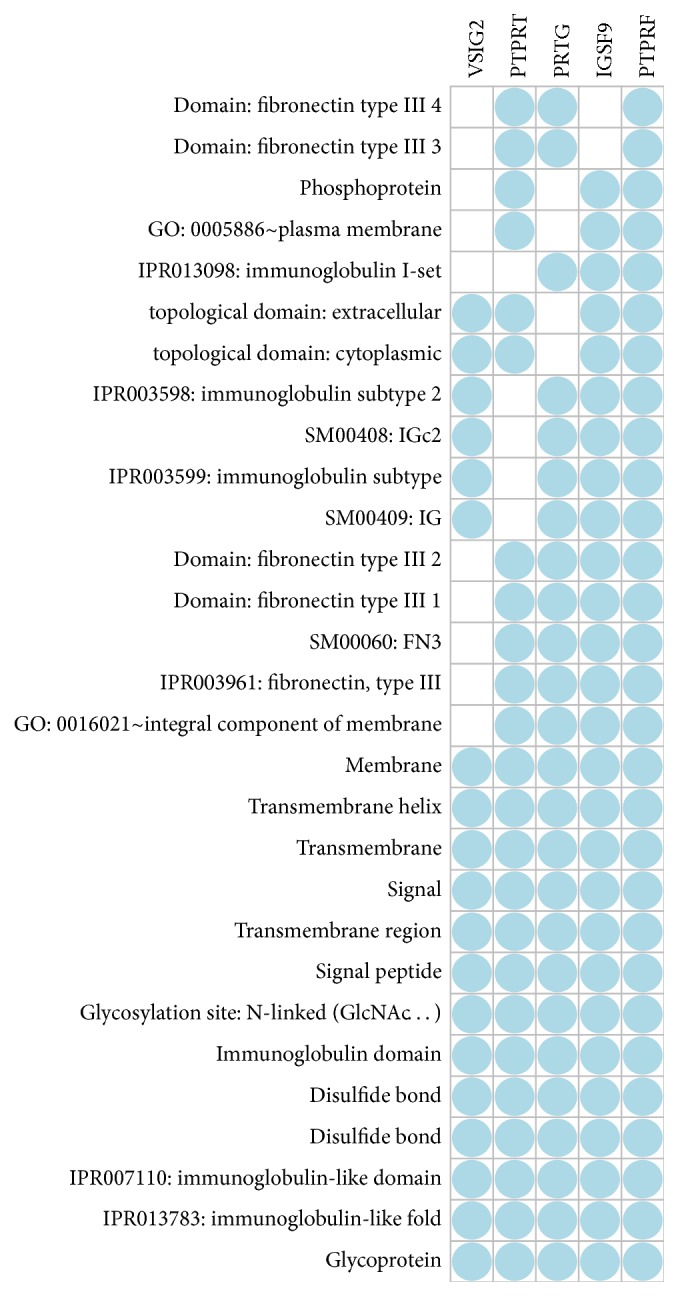
Gene functional classification. With either medium or high stringency, the gene functional classification tool from NIH DAVID bioinformatics resource produced only one cluster consisting of 5 genes when fed with 66 genes at adjust p value < 0.01 as shown in the Supplementary Table 2. Columns are genes names and rows show the related functional categories shared by the genes indicated by the blue dots.