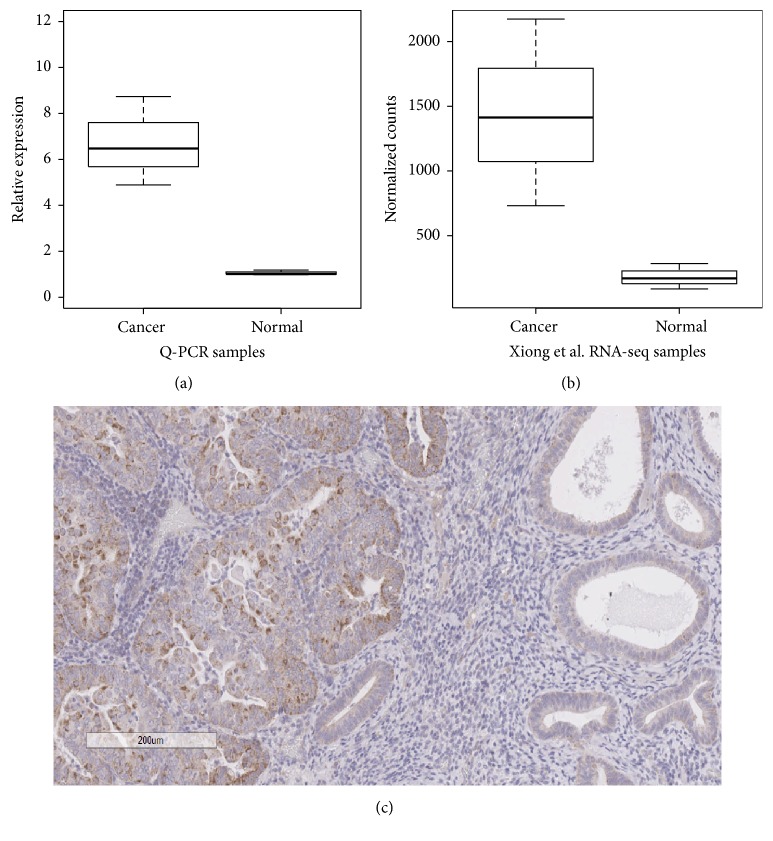
Figure 4.
Expression of IGSF9 in normal endometrium and endometrial carcinoma. (a) Q-PCR measurement of IGSF9 from RNA samples of three paired cancer and normal tissues; the Wilcoxon signed rank test gives p value = 0.25, while the paired t-test gives p value = 0.038. (b) Reanalysis of published RNA-seq data from Xiong et al. [9]; the Wald test gives p value = 6.80E − 10 and adjusted p value = 1.27E − 07. (c) IHC staining of IGSF9, the right half is noncancerous endometrial glands with weak brown stain, while the left side cancer cells stained strongly brown indicating higher level of expression.

