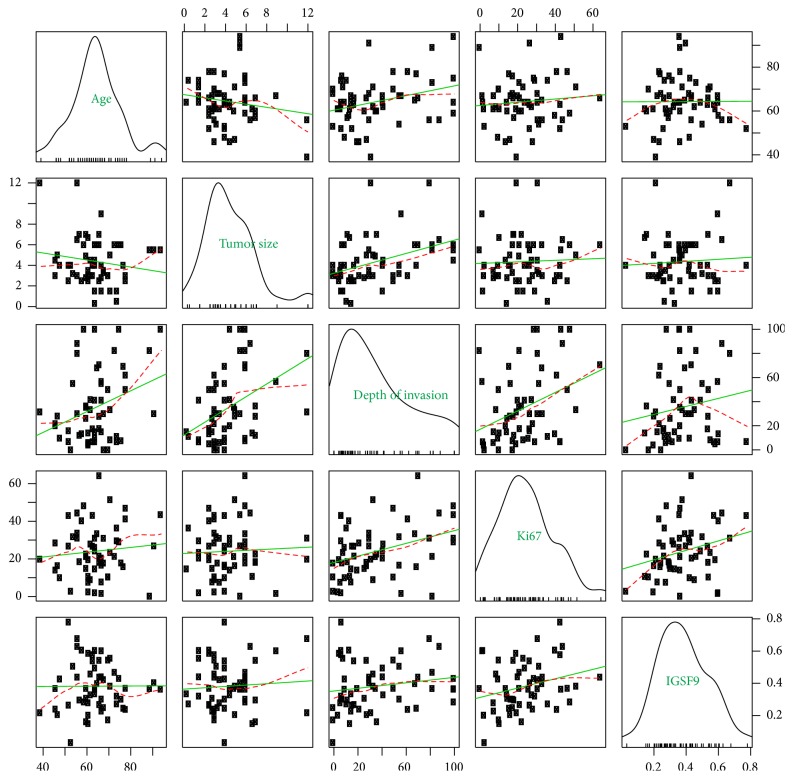
Figure 7.
IGSF9 expression in association with continuous clinicopathologic features. Scatter plots showing the pairwise correlations of age (years), tumor size (diameter in cm), depth of myometrium invasion (percentage of the entire myometrium thickness), Ki67 label index (positive percentage of tumor cells), and IGSF9 positivity (positive percentage of analyzed pixels) with each other in the off-diagonals. Loess smoothed (red) and linear (green) fit lines were superimposed on these plots. Each parameter was named in the principal diagonal overlaid with density and rug plots of that parameter. Depth of myometrial invasion correlated with tumor size (coefficient = 0.412, p value = 0.020) and Ki67 labeling index (coefficient = 0.360, p value = 0.006).

