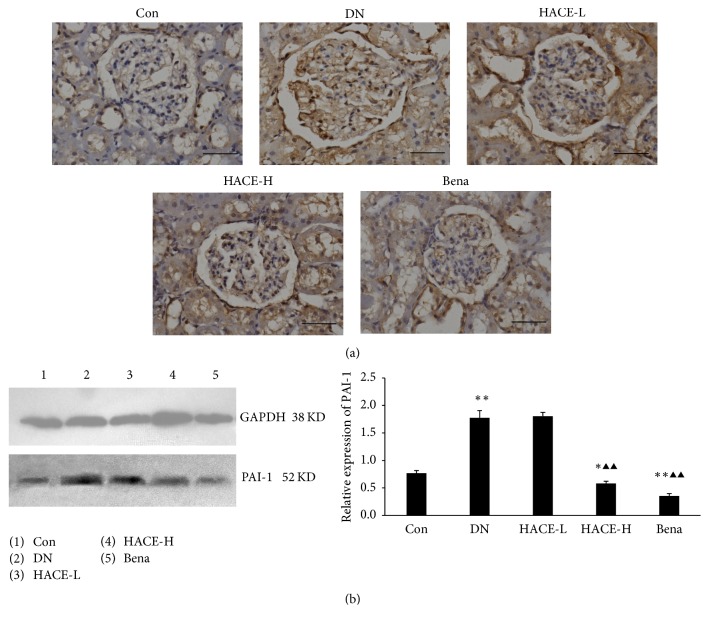
Figure 6.
HACE suppressed the expression of PAI-1 in kidney of rats with diabetic nephropathy. (a) The expression of PAI-1 by immunohistochemistry. Bar = 100 μm. (b) The expression of PAI-1 by Western blot. GAPDH was shown as a loading control. The relative expression was the ratio of PAI-1 to GAPDH conducted by densitometric analysis. Con: nondiabetic control group; DN: streptozotocin-induced diabetic group; HACE-L: low-dose-HACE-treated group; HACE-H: high-dose-HACE-treated group; Bena: benazepril. ∗P < 0.05 versus Con; ∗∗P < 0.01 versus Con; ▲▲P < 0.01 versus DN.

