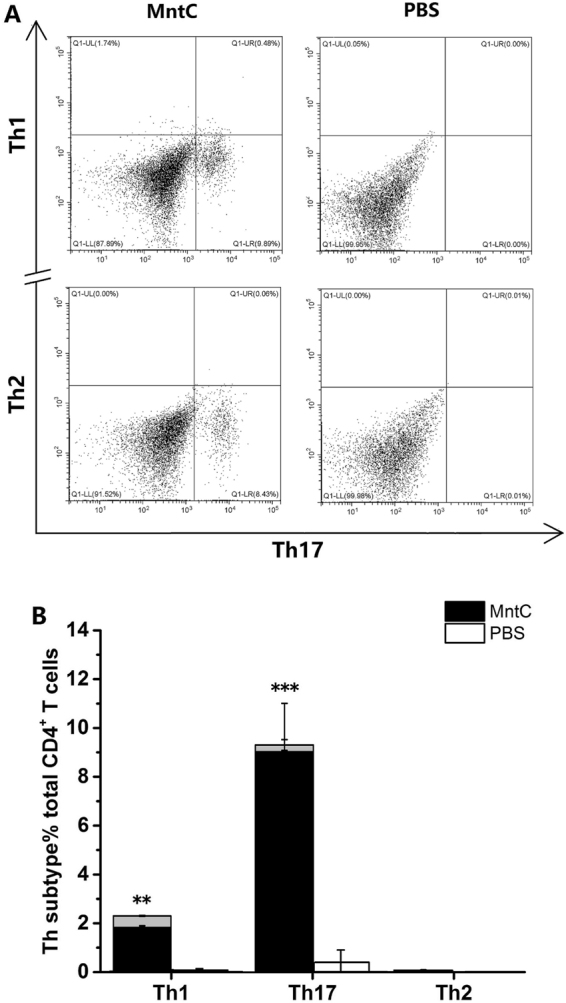
Figure 5.

Phenotypic analysis of CD4+ T cells after immunization by MntC. (A) After 7 days’ incubation, lymphocytes were collected and treated with PMA, ionomycin and Golgistop for 6 hours. Then these cells were washed and stained with fluorescent antibody for Th1, Th17 and Th2, analyzing by flow cytometry. (B) Th1, Th17 and Th2 cell responses of all immunized mice were statistically analysed. The grey bars represent the proportion of double-positive cells. Significant differences were indicated by (*P < 0.05), (**P < 0.01) and (***P < 0.001).
