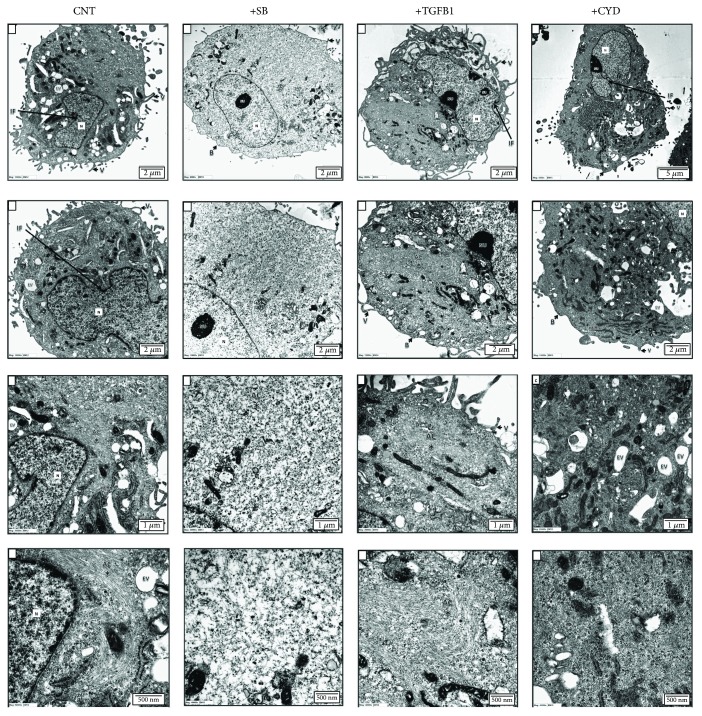
Figure 4.
Transmission electron microscopy of MSCs with and without treatment with SB-431542, TGFβ1, or CYD. TEM ultrastructural analysis of MSCs following no treatment (CNT) or treatment with SB-431542 (SB), TGFβ1, or CYD. Increasing levels of magnification are indicated by scale bars. N: nucleus; Nu: nucleolus; AC: actin filaments; V: microvilli; M: mitochondria; PL: primary lysosome; SL: secondary lysosome; rER: rough endoplasmic reticulum; G: Golgi bodies; B: cell blebs; P: cell processes; IF: nuclear membrane infolding; EV: endocytotic vacuole.

