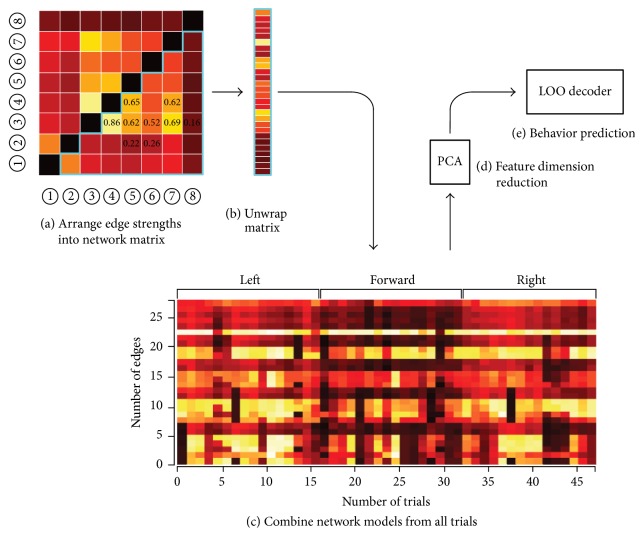
Figure 2.
Flowchart illustrating neural functional network decoding. First, the feature bands in the LFP were extracted by wavelet filtering according to the time-frequency spectral analysis results. The functional connectivities among LFPs were then calculated and the connection strengths were arranged in a network matrix. Second, the connection strength values from the matrix were reshaped into row vectors, before they were combined with the equivalent connection strengths in all the other trials. Third, the dimension of the trials × edges matrix, which represented all the connection strengths from all the trials, was reduced using the PCA algorithm. Finally, a leave-one-out (LOO) decoder used the matrix with reduced dimensions and the predicted measures to train a set of weights, before the trained weights were combined with the connection strengths matrix to generate a single prediction (one value per trial, i.e., the movement direction of pigeons) of the behavioral measure.

