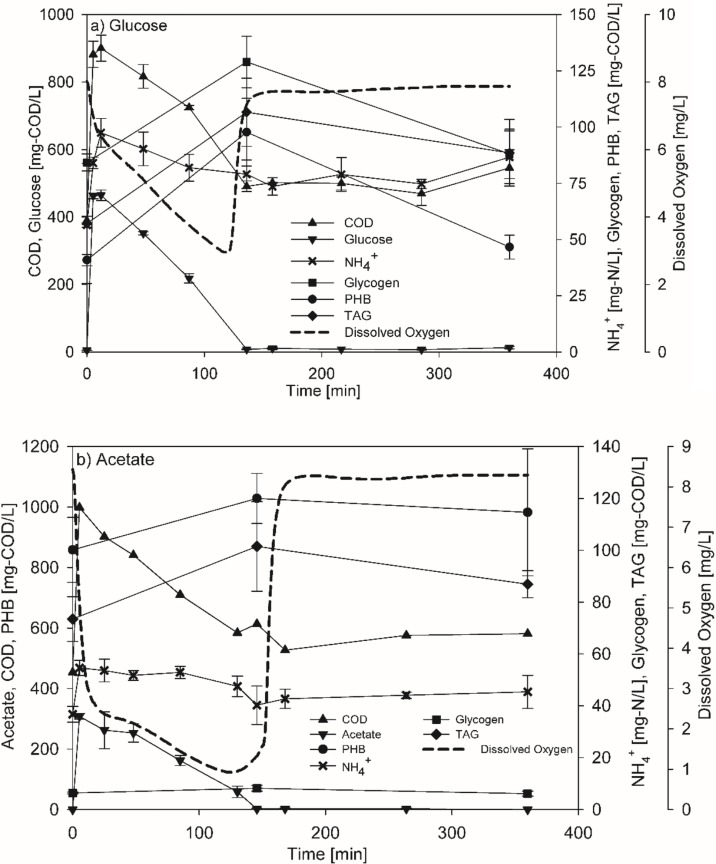
Fig 1.
Dynamics in concentrations of metabolite pools for cultures of R. jostii RHA1 during 6-hour cycle of SBRs fed glucose (a) or acetate (b) once steady-state was achieved. SRT was 1 day. Except for DO which are representative profiles, the data points are average of triplicate or duplicate runs for glucose (a) or acetate (b), respectively. Error bars are standard errors. The COD background due to EDTA was measured to be 501.7±12.4 and 576.5±14.1 mg-COD/L for glucose (a) and acetate (b), respectively.

