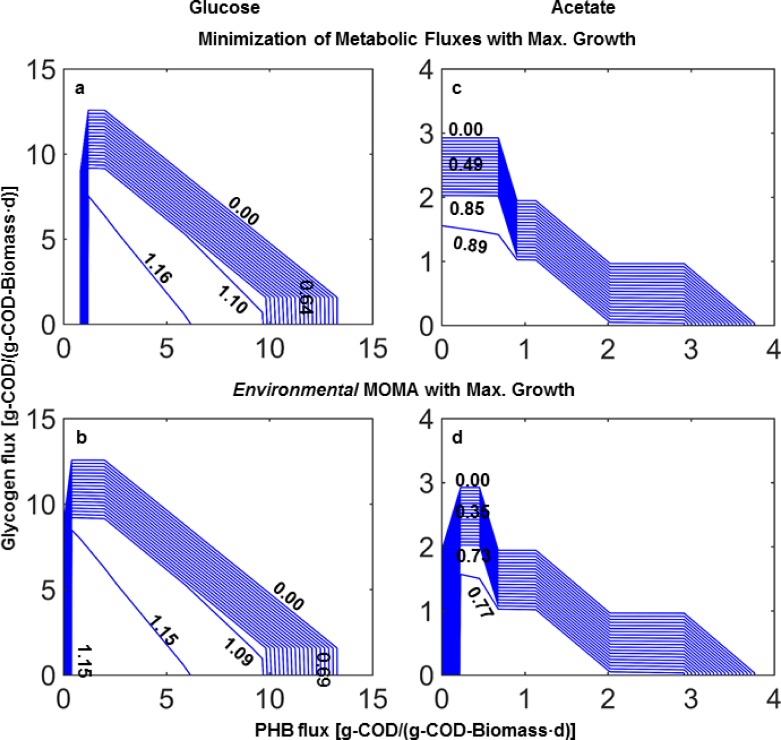
Fig 2.
Contour plots of flux balance results obtained with the two sub-objective functions for weighted average maximum growth rates (isolines, units d-1) in function of pairs of glycogen and PHB storage fluxes at experimentally observed glucose—panels a and b: 14.2 g-COD/(g-COD-Biomass·d)—and acetate uptake rates -panels c and d: 4.9 g-COD/(g-COD-Biomass·d). TAG fluxes were adjusted to experimentally observed values—panels a and b: 1.1 g-COD/(g-COD-Biomass·d), and panels c and d: 0.3 g-COD/(g-COD-Biomass·d).

