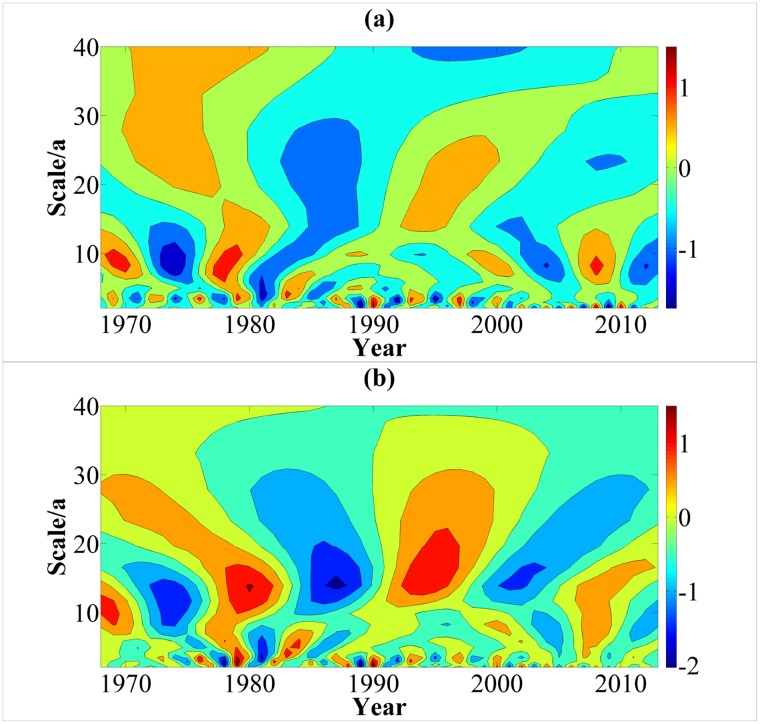
Fig 7. Time-frequency structure figure of the real part of Morlet wavelet transform coefficients of annual precipitation (a) and runoff (b).
Fig 7 describe the high and low flow phase structures under different time scales by employing Matlab 7.0. And tone from warm to cold represent high values to low values of the real part of Morlet wavelet transform coefficients.

