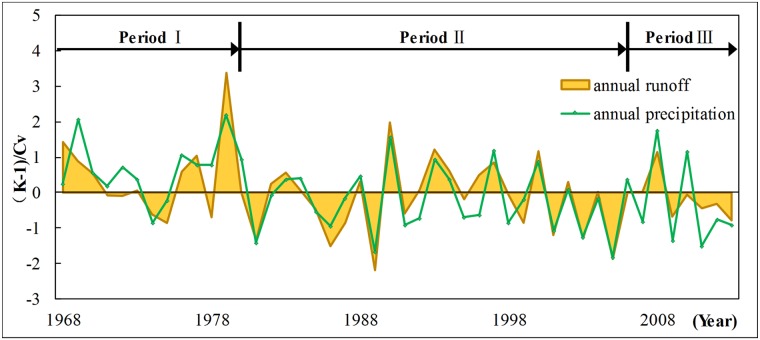
Fig 10. Normalized curve of annual runoff and annual precipitation.
This figure shows the multiyear variation curve after standardization treatment of annual runoff (yellow area) and annual precipitation (green line) in study area. Time periods 1968–1980, 1981–2006 and 2007–2013 are represented by period I, II and III. Period divided on the basis of the goodness of fit between annual runoff and annual precipitation. Annual runoff and precipitation exhibit a good synchronous change relationship in the fluctuation in period II and show a clear separation in period I and III.

