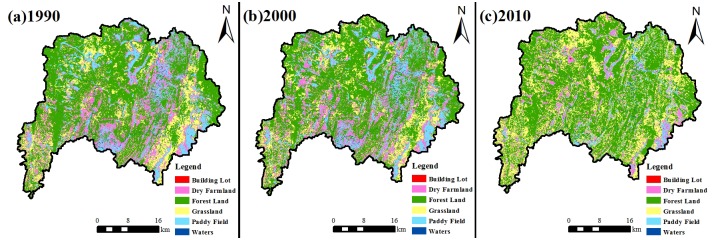
Fig 11. Spatial distribution maps of land use in 1990 (a), 2000 (b) and 2010 (c).
Forestry, grass land, water area, arid land, paddy field and building lot were classified in maps. Overall accuracy values of three-phase land use vector diagram are 96.89%, 98.55% and 93.17%, and kappa coefficient values are 0.95, 0.97 and 0.93. Maps in Fig 11 were generated by ArcGIS 10.2 and ENVI 5.2 and the URL links of software are http://www.esri.com/ of both. Three-phase TM images of 1990, 2000 and 2010 from free download data of U.S. Geological Survey (http://glovis.usgs.gov/) were used.

