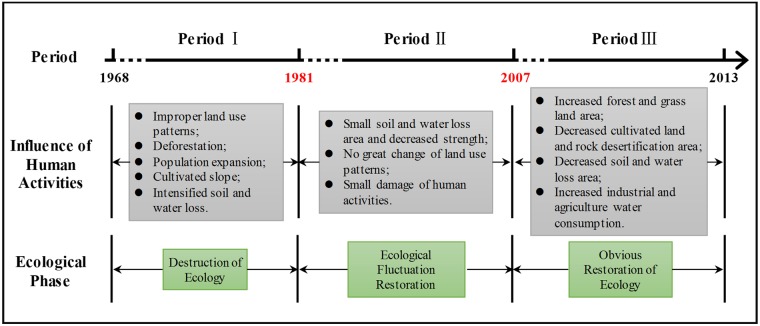
Fig 14. The time axis of influence of human activities during the research period.
Basis for division of periods are the same as Fig 10. Content in gray squares indicate the main human activities of different stages. Content in green squares show ecological phase of different stages.

