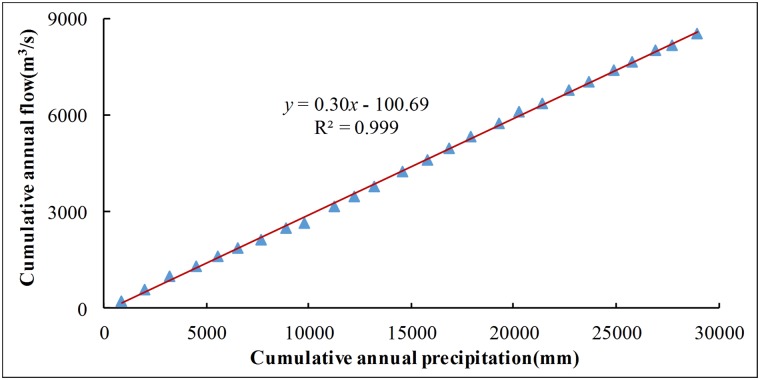
Fig 15. Double mass curve of annual precipitation and runoff during 1981–2006.
Distribution of blue triangles show cumulative values of annual precipitation and runoff. Red line indicates the regression curve line of accumulated precipitation and the accumulated runoff that establishing by linear fitting.

