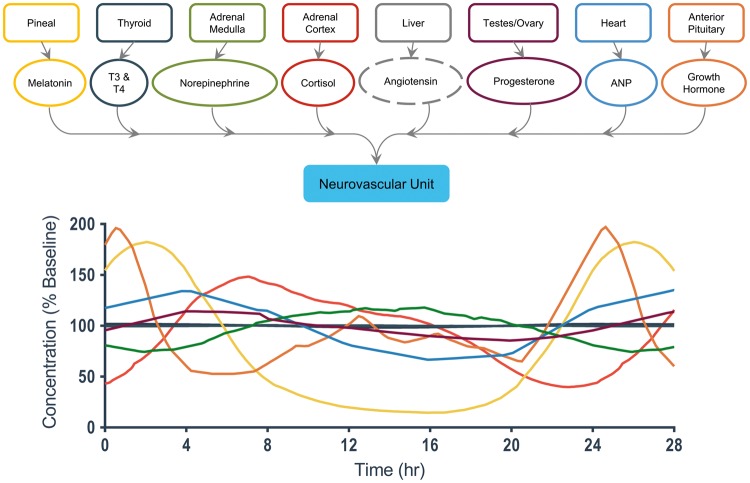
Figure 4.
A detailed view of end-organ interactions for the neurovascular unit.38, 40–42, 44,46, 48 The hormones are color-coded to correspond with the graph below that depicts their relative concentration change, as a percentage of their normal baseline level, over the course of the day. Hormones that did not have significant literature support for a circadian oscillation are given a dashed line to denote a constant concentration.

