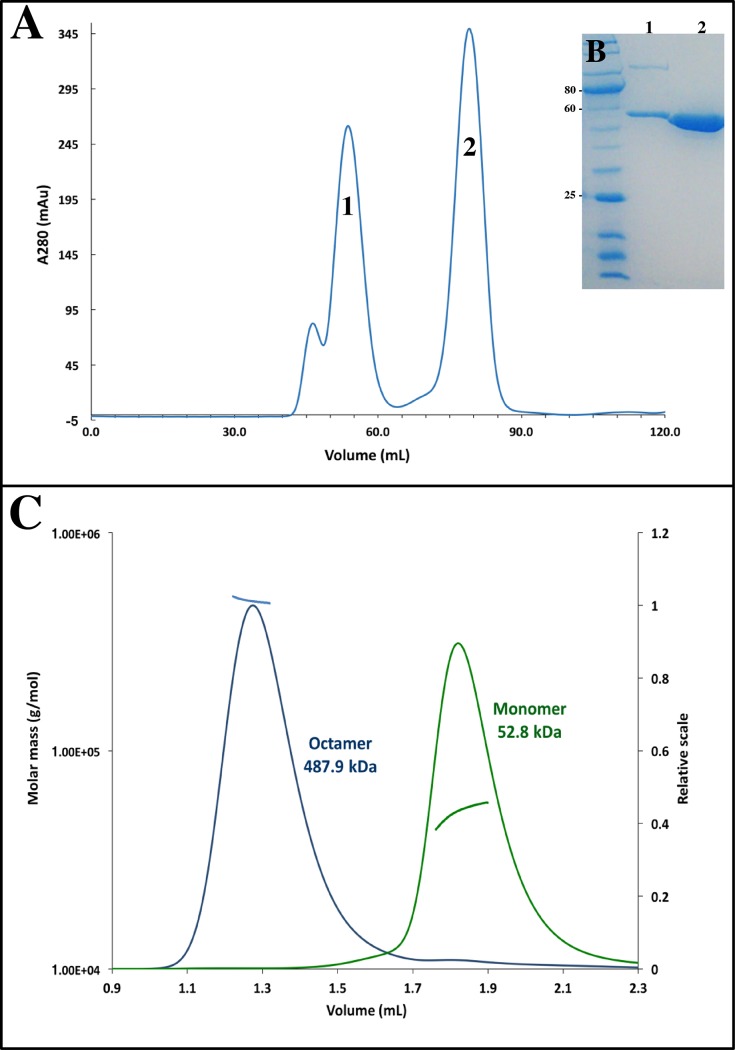
Fig 4. Size exclusion chromatography and MALS analysis.
(A) Size exclusion chromatogram of ScUGPase-1. Peaks between 40 and 60 mL correspond presumably to higher oligomeric forms of ScUGPase-1, whereas the peak at 75 mL corresponds to the monomeric form. (B) Coomassie-stained gel under reducing conditions showing the purity of ScUGPase-1. (C) SEC-MALS analysis of ScUGPase-1. Blue and green lines indicate the trace from the refractive index detector during SEC for the octamer and monomer, respectively. Black lines on each peak correspond to the averaged molecular weight (Mw; y axis) distribution across the peak.

