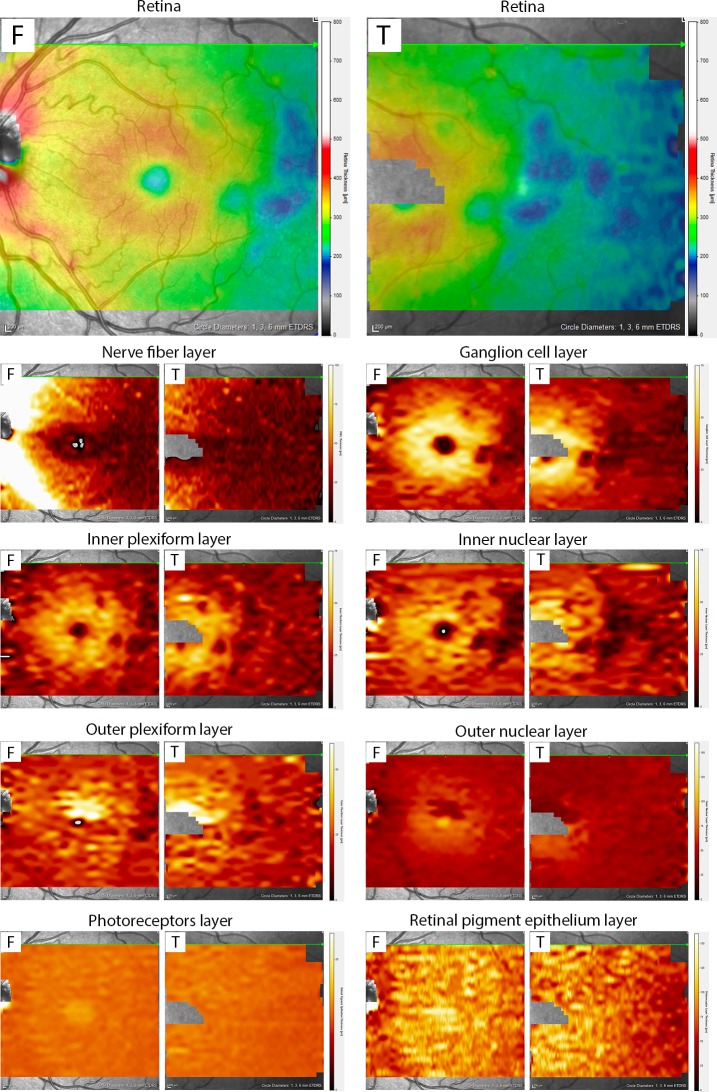
Fig 3. Example of individual retinal layer thickness measurement in subject with sickle cell maculopathy, for both the foveal-centered (“F”) and temporally centered (“T”) scans.
Areas of severe thinning are well recognizable as blue patchy areas on retinal thickness color-coded maps (first row), and correspond to darker areas on the thickness maps for ganglion cell layer (second row), inner plexiform layer and inner nuclear layer (third row), and outer plexiform layer (fourth row). The thickness maps for photoreceptors and retinal pigment epithelium do not show any patchy thinning.

