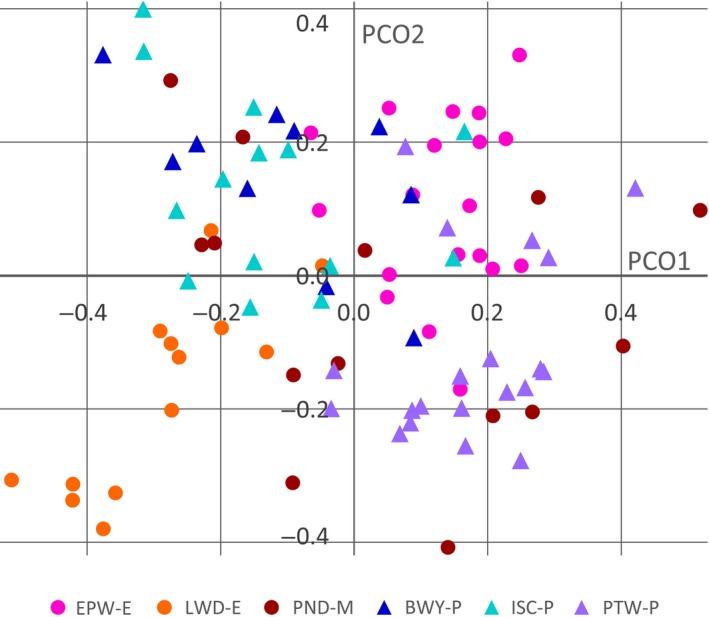
Figure 2.

Principal coordinates analysis of single‐nucleotide polymorphisms (SNP) in the six UK subpopulations of Hymenoscyphus fraxineus. Isolates from established sites are shown by red, pink and orange circles and isolates from planted sites are shown by blue, purple and turquoise triangles. Subpopulations are not separated from each other on the first two principal coordinates except for EPW‐E and LWD‐E, which are separated from each other but not from any other subpopulation.
