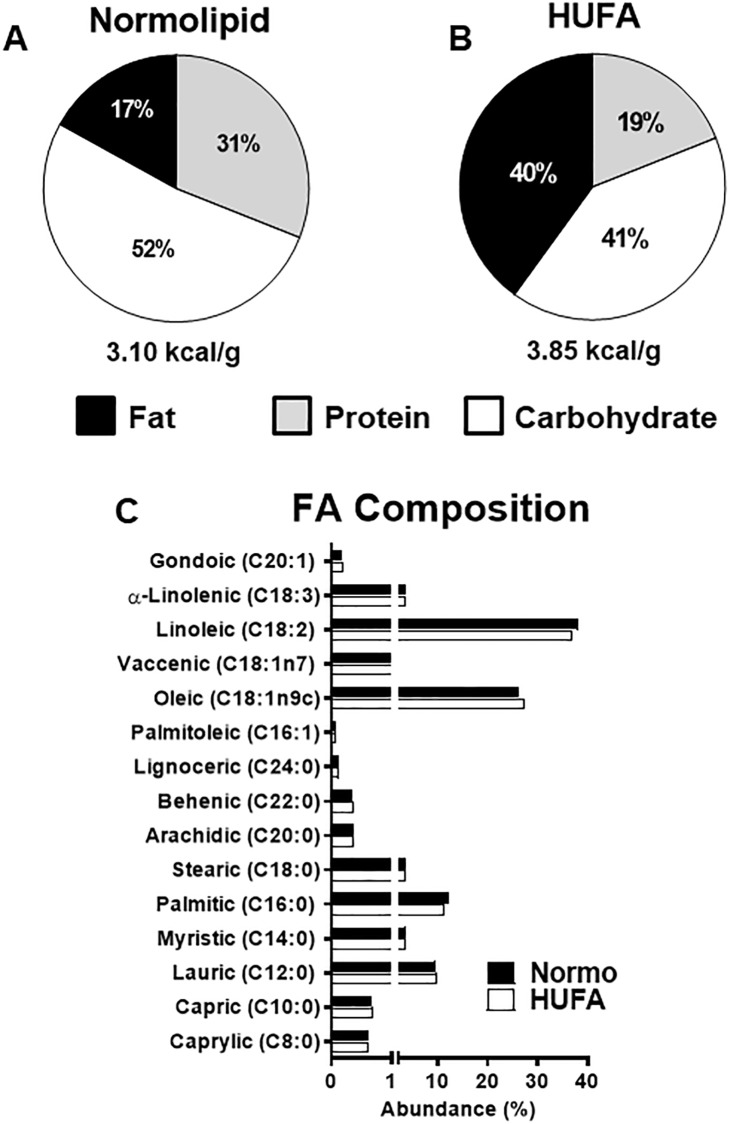
Fig 1. Caloric content and fatty acid composition of diets used in the study.
(A-B) The percentage of total calories arising from fats (black), protein (grey), and carbohydrates (white) in the normolipid (Normo) and high unsaturated fat diet (HUFA). (C) The relative abundance of fatty acids in both diets. Fatty acids are organized by degree of unsaturation and carbon length.

