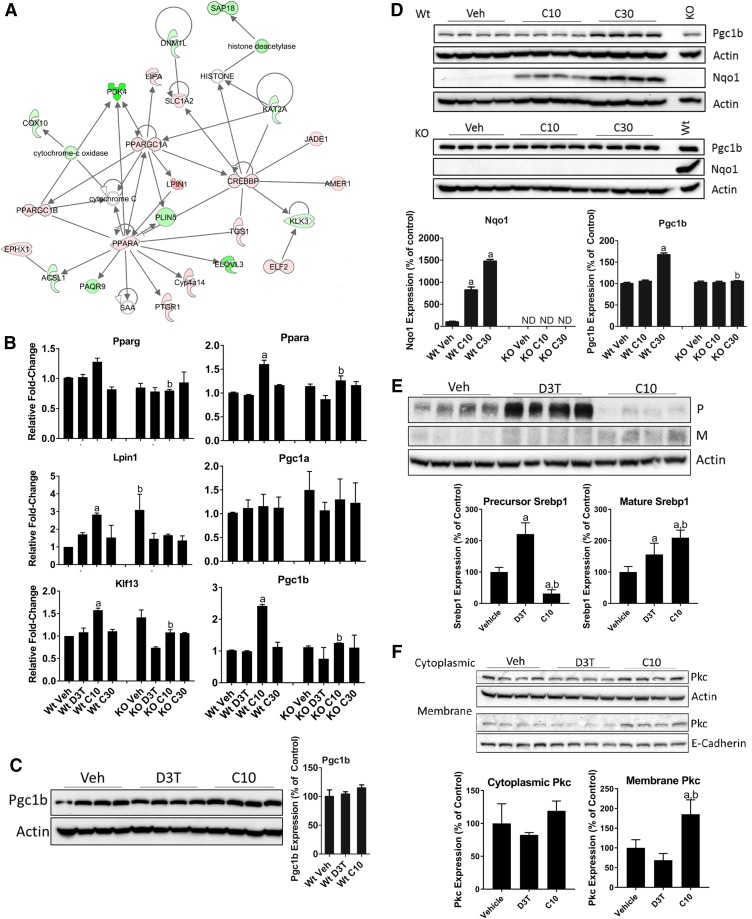
Fig. 4.
CDDO-Im selectively regulates lipid metabolism. (A) IPA of Nrf2-dependent genes unique to CDDO-Im (meta cluster 3, Table 2) combined with the common response genes (meta cluster 1, Table 2) identified the lipid metabolism pathway. Red nodes are upregulated, green nodes are downregulated, and the color intensity of each node indicates the magnitude of regulation as determined by microarray. (B) Measurement by qPCR of levels of RNA of the indicated genes. Animals were treated as described in the Materials and Methods with doses of 300 μmol/kg b.wt. D3T or 3, 10, or 30 μmol/kg b.wt. CDDO-Im. Values are expressed as the average fold-change ± S.E.M. in the liver of Wt or Nrf2-null (KO) mice (n = 2 independent experiments of four animals/treatment group per genotype each). Expression of Gapdh, which was unchanged by treatment or genotype, was used for normalization. Results were analyzed using a two-way ANOVA followed by Tukey’s multiple-comparisons test. aP < 0.05 relative to the Wt vehicle; bP < 0.05 relative to the Wt sample of the matching treatment and dose. (C) PGC1B expression in 50 μg total liver protein from Wt mice treated with 300 μmol/kg b.wt. D3T or 10 μmol/kg b.wt. CDDO-Im. β-actin, which was unchanged by treatment or genotype, was used as a loading control. Values are expressed as the average percentage of the Wt vehicle control, which was set to 100% ± S.D. in the liver of Wt mice (n = 4/treatment group). Results were analyzed using a one-way ANOVA. (D) PGC1B and NQO1 expression in 50 μg total liver protein from Wt or Nrf2-null mice treated with 10 or 30 μmol/kg b.wt. CDDO-Im. β-actin, which was unchanged by treatment or genotype, was used as a loading control; data were normalized to a common sample loaded on both gels to allow for comparisons between genotypes. A sample from the 30 μmol/kg b.wt. CDDO-Im–treated Wt tissue, labeled “Wt,” was loaded on the KO gels to serve as an NQO1 antibody detection control. Values are expressed as the average percentage of the Wt vehicle control, which was set to 100% ± S.D. in the liver of Wt or Nrf2-null (KO) mice (n = 4/treatment group per genotype). Results were analyzed using a one-way ANOVA followed by Dunnett’s multiple-comparisons test (NQO1) or by two-way ANOVA followed by Tukey’s multiple-comparisons test (PGC1B). aP < 0.05 relative to the Wt vehicle (Veh); bP < 0.05 relative to the Wt sample of the matching treatment and dose. (E) SREBP1 expression) in 50 μg total liver protein from Wt mice treated with 300 μmol/kg b.wt. D3T or 10 μmol/kg b.wt. CDDO-Im. β-actin, which was unchanged by treatment, was used as a loading control. Values are expressed as the average percentage of the Wt vehicle control, which was set to 100% ± S.D. in the liver of Wt mice (n = 4). Results were analyzed using a one-way ANOVA followed by Tukey’s multiple-comparisons test. aP < 0.05 relative to the vehicle; bP < 0.05 relative to the D3T-treated sample. (F) Localization of PKC in 50 μg cytoplasmic or membrane liver protein fractions from Wt mice treated with 300 μmol/kg b.wt. D3T or 10 μmol/kg b.wt. CDDO-Im. β-actin and E-cadherin, which were unchanged by treatment, were used as loading controls and specific markers of cytoplasmic and membrane fractions, respectively. Values are expressed as the average percentage of the vehicle control, which was set to 100% ± S.D. (n = 4). Results were analyzed using a one-way ANOVA followed by Tukey’s multiple-comparisons test. aP < 0.05 relative to the vehicle; bP < 0.05 relative to the D3T-treated sample. ANOVA, analysis of variance; Gapdh, glyceraldehyde 3-phosphate dehydrogenase; KO, knockout; M, mature form; ND, no protein was detected above background; P, precursor; Veh, vehicle.

