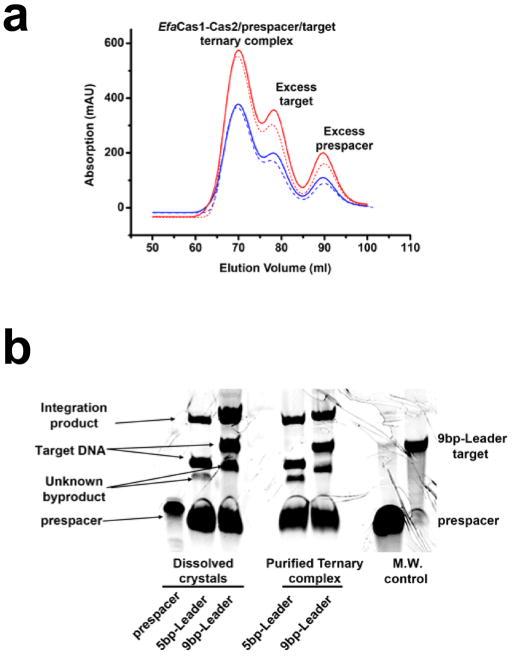
Extended Data Figure 5. SEC and crystal content analyses.
a, Size-exclusion Chromatography (HiLoad 16/60 Superdex 200) of two EfaCas1-Cas2/prespacer/target ternary complexes. The solid line corresponds to the ternary complex with the 5bp-leader DNA that yielded the half-integration structure; the dotted line is for the 9-bp-leader DNA containing complex that yielded the full-integration structure. Red and blue traces correspond to 260 and 280 nm UV absorptions, respectively. The two complexes eluted at the same retention volume of 69 ml, which corresponds to an estimated molecular weight of 200 kDa. This suggests the two complexes had the same stoichiometry before crystallization (Cas14:Cas22:prespacer:target). b, SDS-PAGE analysis of the dissolved crystals, side-by-side with the before-crystallization sample. Note the relative intensity of the target DNA band and the integration product band. The 5-leader crystal contained less integration product than the starting sample, which is consistent with the resulting structure containing two Cas1-Cas2/prespacer complexes bound to one DNA target. In contrast, the 9-leader crystal contained the extent of integration product as before-crystallization, which is consistent with it yielding a fully integrated crystal structure. The cleaved leader DNA ran out of the gel due to its much smaller size.

