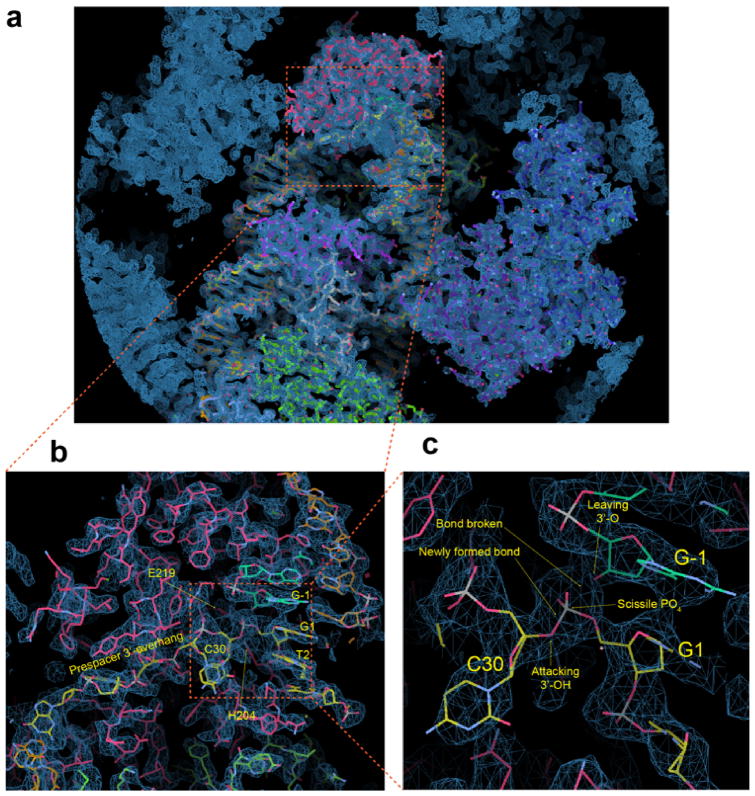
Extended Data Figure 6. Unbiased Se-Met experimental phases superimposed with the half-integration structure.
a, overall view, b, zooming into the half-integration site and c, further zoom-in at the integration site. The reactants including the 3′-OH, scissile phosphate, and the leaving 3′-O are labeled. All maps are contoured at 1.5 sigma. The structure is modeled in the post half-integration state, however, the density in c is consistent with either pre- or post-integration scenario.

