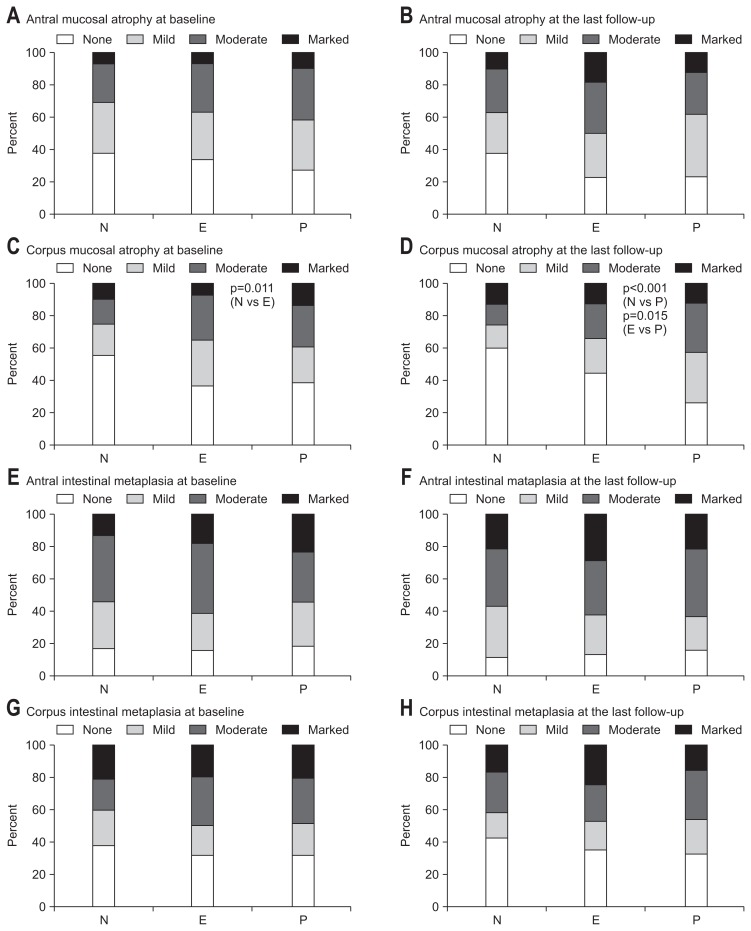
Fig. 1.
The proportions of patients with precancerous lesions. (A) Antral mucosal atrophy at baseline. (B) Antral mucosal atrophy at the last follow-up. (C) At baseline, the proportion of patients with corpus mucosal atrophy was higher in the eradicated group than in the negative group (p=0.011). (D) At the last follow-up, the proportion of patients with corpus mucosal atrophy was higher in the persistent group than in the negative and eradicated groups (p<0.001 and p=0.015, respectively). (E) Antral intestinal metaplasia at baseline. (F) Antral intestinal metaplasia at the last follow-up. (G) Corpus intestinal metaplasia at baseline. (H) Corpus intestinal metaplasia at the last follow-up. p-values are greater than 0.05 unless otherwise stated.
N, negative group; E, eradicated group; P, persistent group.

