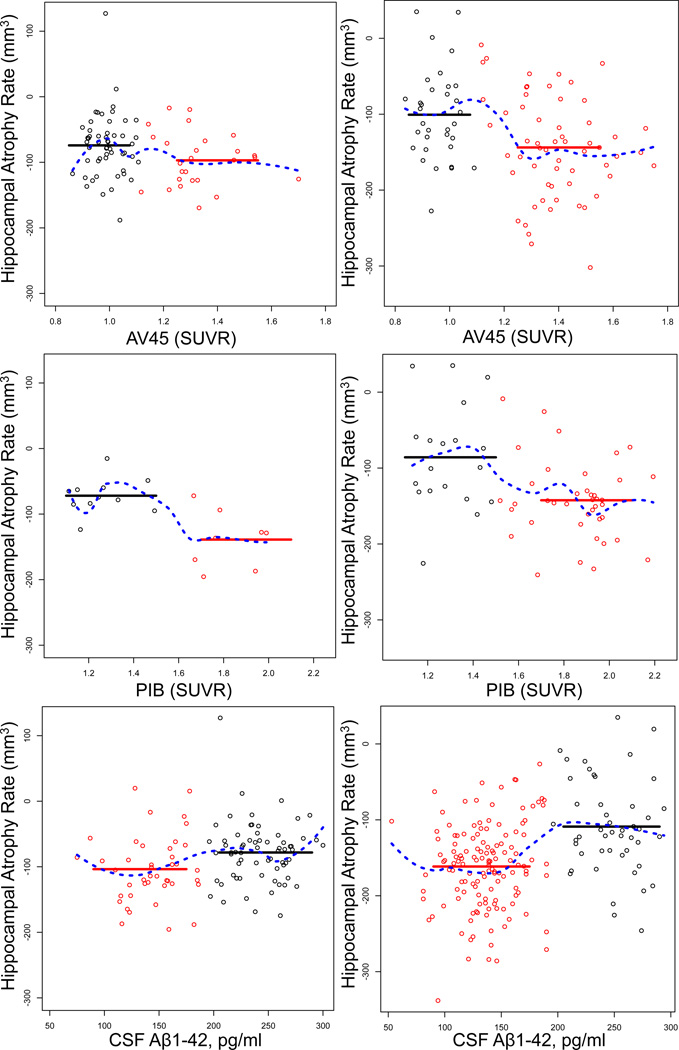
Figure 1. The effect of Aβ levels on HAR in NC and MCI.
Scatter plots showing the correlation between 3 different measures of Aβ levels (AV45, A and D; PIB, B and E; CSFAβ1–42, C and F) and HAR in NC (A–C) and MCI (D–F) participants. Regression analysis (blue dotted line) shows the best fit as a sigmoid that delineates two subpopulations of participants, Aβ+ (red squares) and Aβ− (black squares). The threshold values used are 1.11 SUVR for AV45, 1.5 SUVR for PIB, and 192 pg/ml. for CSFAβ1–42. Solid red and black lines represent the mean values for the Aβ+ (red) and Aβ− (black) subgroups.

