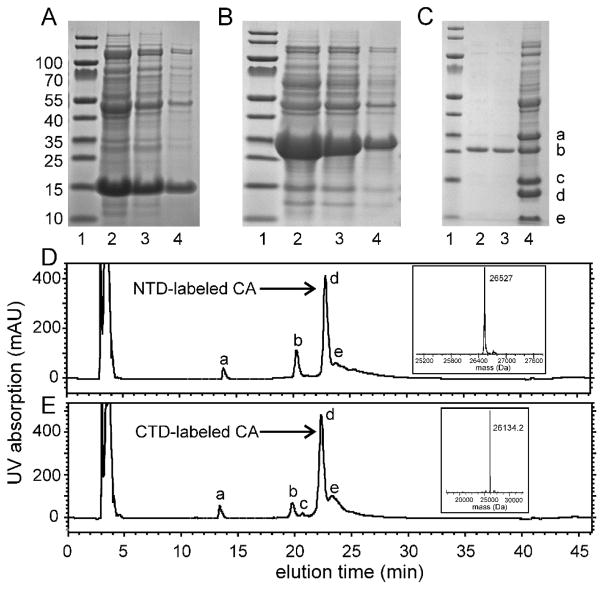
Figure 2.
(A) SDS-PAGE analysis of the cell lysate from overexpresssion of the CTD-intein fusion protein. Lane 1 contains molecular weight markers. Lanes 2–4 contain decreasing quantities of the lysate. The band near 15 kDa is the CTD-intein fusion protein. Gels were stained using Imperial protein stain from ThermoFisher Scientific. (B) Same as panel A, but for the NTD-intein fusion protein, which is the band near 30 kDa. (C) SDS-PAGE analysis of the ligation mixture after 40 h of incubation (lane 4) and the purified ligation product (lanes 2 and 3). Bands marked a–e are the NTD-intein fusion protein, ligated HIV-1 CA, the CTD-intein fusion protein, the N-terminal intein segment of Npu DnaE, and the C-terminal intein segment, respectively. (D) Reverse phase HPLC chromatogram of the ligation mixture after 40 h of incubation to produce full-length CA with a uniformly 15N,13C-labeled NTD segment. UV absorption peaks (280 nm) marked a–e are the C-terminal intein segment, the CTD-intein fusion protein, the N-terminal intein segment, the ligated CA product, and the NTD-intein fusion protein, respectively. The inset shows the mass spectrum of peak d, after deconvolution of multi-charged mass data from electrospray ionization. (E) Same as panel D, but for production of full-length CA with a uniformly 15N,13C-labeled CTD segment.

