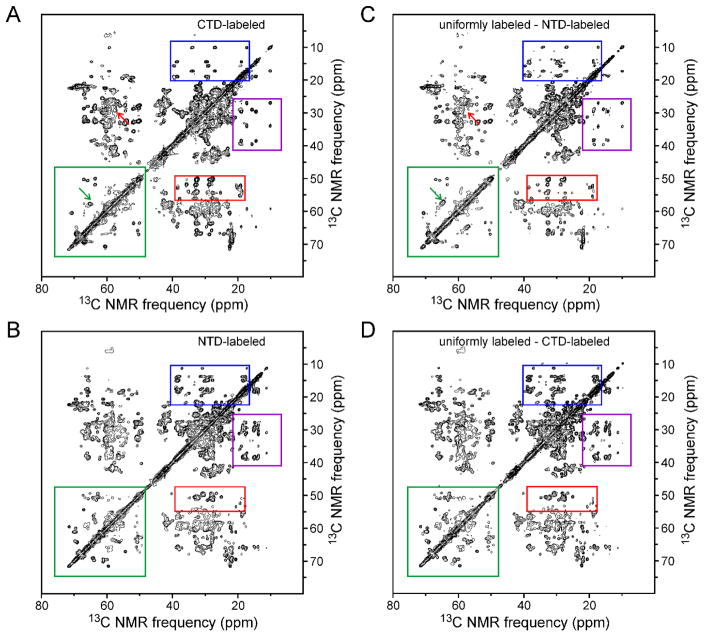
Figure 4.
(A,B) Aliphatic regions of 2D solid state 13C-13C NMR spectra of CTD-labeled CA assemblies and NTD-labeled CA assemblies, respectively. Color-coded rectangles indicate regions where clear differences in crosspeak patterns are observed. (C) 2D spectrum obtained by subtracting the spectrum of NTD-labeled CA assemblies from that of fully-labeled CA assemblies. (D) 2D spectrum obtained by subtracting the spectrum of CTD-labeled CA assemblies from that of fully-labeled CA assemblies. Green arrows in panels A and C indicate a crosspeak from S149 that is present in panel C but absent from panel A, due to the S149C substitution in the segmentally labeled samples. Red arrows indicate a crosspeak from C149 or C198 that is present in panel A but absent from panel C. Contour levels increase by successive factors of 1.7.

