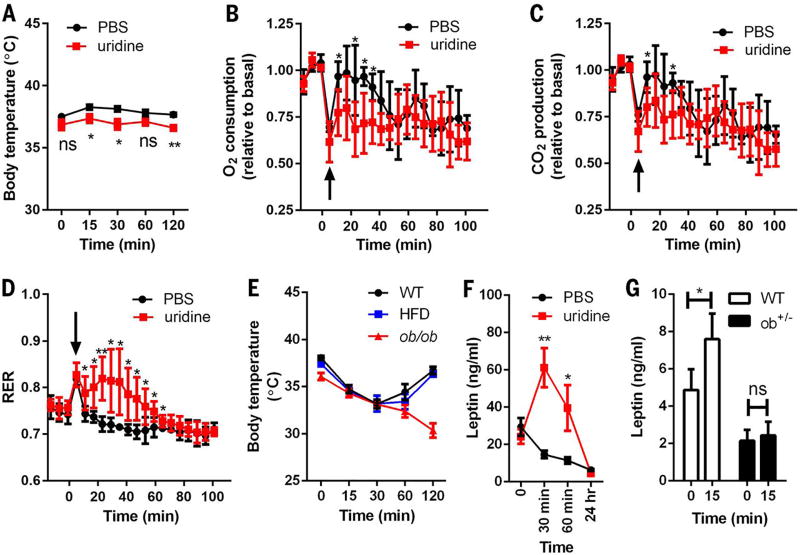
Fig. 3. Thermoregulation effects of uridine.
(A) Male C57BL/6 mice were injected intraperitoneally (i.p.) with PBS or uridine (1 g/kg) at room temperature (22° to 25°C), then transferred to a chamber at 29°C, and monitored for their body temperature (n = 6 per group). (B to D) Injection of uridine (i.p., 1 g/kg) reduced the rates of O2 consumption and CO2 production, but increased RER of male C57BL/6 mice in an indirect calorimetry study (n = 5 per group). The arrows indicate the changes due to cage opening. Values of VO2 and VCO2 were plotted relative to the baseline measurements. (E) Body temperature was monitored in male WT and ob/ob mice after uridine i.p. injection (1 g/kg) at the indicated time point. The HFD group consisted of male WT mice fed with HFD for 15 weeks (n = 5 per group). (F) Plasma leptin levels in WT mice (HFD for 15 weeks) were measured before and after uridine i.p. injection (1 g/kg) (n = 6 per group). (G) Plasma leptin levels in WT and ob+/− mice were measured before and 15 min after uridine i.p. injection (1 g/kg) (n = 6 per group). Statistical analysis was performed for different treatments or genotypes at indicated time points if not specified. Data were analyzed with two-tailed Student t test. *P < 0.05, **P < 0.01. Error bars denote SEM.

