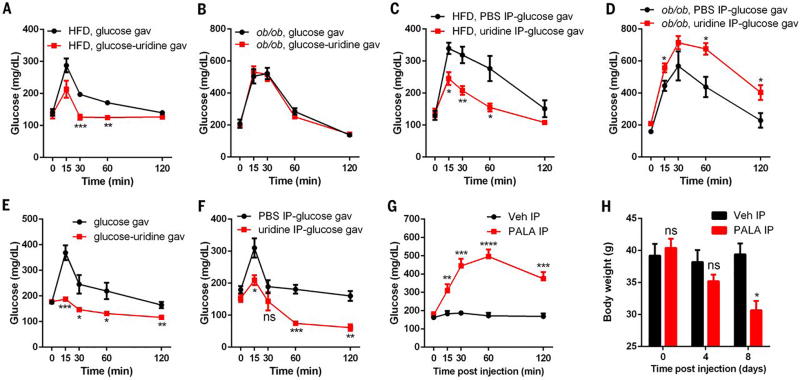
Fig. 5. Uridine effects on glucose metabolism.
(A and B) Plasma glucose levels from male WT mice (HFD for 25 weeks) or ob/ob mice were measured in oral glucose tolerance tests with glucose or glucose-uridine solution (n = 6 per group). (C and D) Plasma glucose levels from male WT mice (HFD for 25 weeks) or ob/ob mice were measured in oral glucose tolerance tests with PBS or uridine intraperitoneal injection 15 min before glucose gavage (n = 6 per group). (E) Plasma glucose levels from male C57BL/6 mice (18 months old) were measured in oral glucose tolerance tests with glucose or glucose-uridine solution (n = 6 per group). (F) Plasma glucose levels from male C57BL/6 mice (18 months old) were measured in oral glucose tolerance tests with PBS or uridine intraperitoneal injection 15 min before glucose gavage separately (n = 6 per group). (G and H) Plasma glucose levels and body weight were measured in male C57BL/6 mice (HFD for 30 days) before and after i.p. injection with PALA or vehicle (Veh) (n = 5 per group). Statistical analysis was performed for different treatments at indicated time points if not specified. Data were analyzed with two-tailed Student t test. *P < 0.05, **P < 0.01, ***P < 0.001, ****P < 0.0001. Error bars denote SEM.

