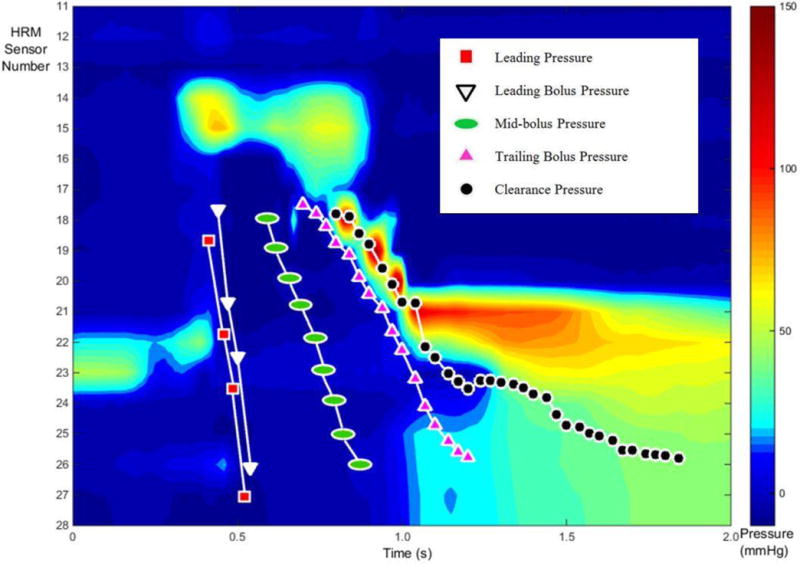
Fig. 5.

An alternate display of the five described pressure events superimposed on the corresponding HRM spatiotemporal plot from a single swallow. Each marker indicates the timing and positioning of the event as caught on videofluoroscopy, and then aligned with HRM data. The number of markers for each event varies due to the rate of movement on videofluoroscopy. For example, the bolus head moves much more rapidly than the tail and therefore has less event specific markers.
