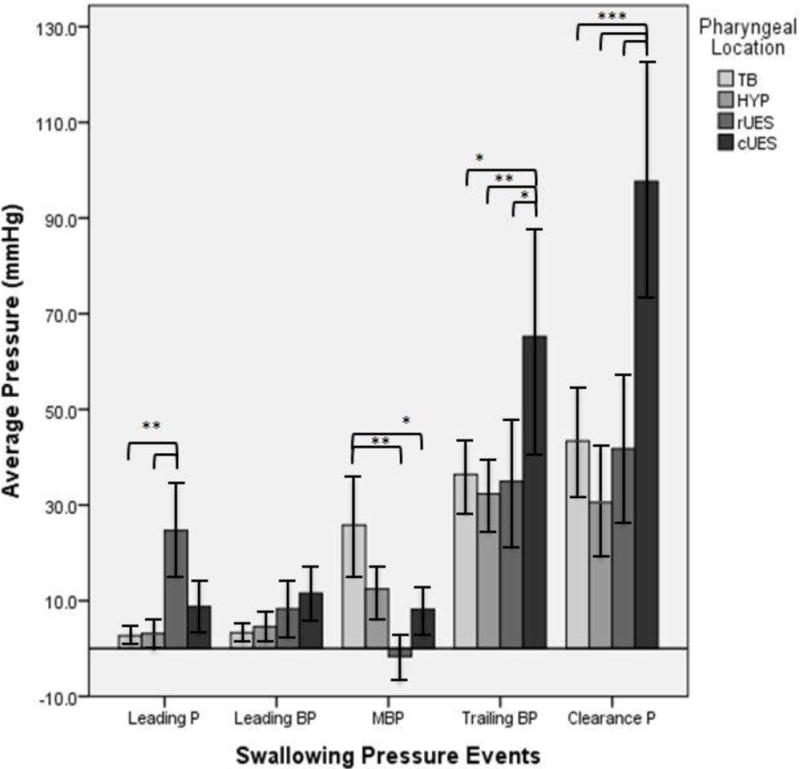
Fig. 6.

An overview of all the pressure profiles, divided out by swallowing pressure event then pharyngeal location. P = Pressure, BP = Bolus Pressure, MBP = Mid Bolus Pressure, ‘rUES’ rostral upper esophageal sphincter, and ‘cUES’ caudal upper esophageal sphincter.
Within individual pressure events, significant pressure differences were observed across regions. For the leading pressure event, average pressure at the rUES was significantly greater than at the tongue base and hypopharynx. For the mid-bolus pressure event, average pressure at the tongue base is significantly greater than at the rUES and the cUES. For the trailing bolus pressure event, average pressure at the cUES is significantly greater than at the tongue base, hypopharynx, and rUES. For the clearance pressure event, average pressure at the cUES is significantly greater than at the tongue base, hypopharynx, and rUES. Error bars indicated standard error of the mean. *P < 0.05. **P < 0.01. ***P <0 .001.
