Figure 2.

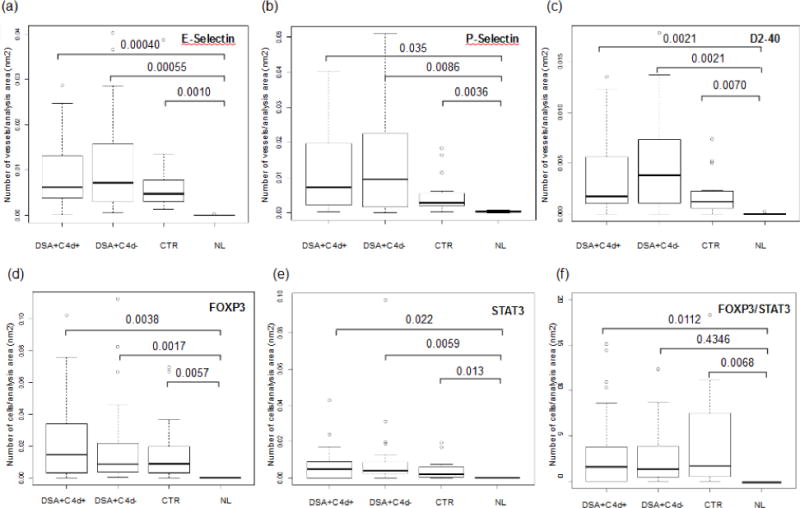
Expression of markers of endothelial activation and lymphangiogenesis (a, b and c) and T-helper subsets (d, e, and f) in different study groups (DSA+, C4d+, DSA+, C4d−), control (C4d−, DSA−; CTR) and normal kidneys (NL).

Expression of markers of endothelial activation and lymphangiogenesis (a, b and c) and T-helper subsets (d, e, and f) in different study groups (DSA+, C4d+, DSA+, C4d−), control (C4d−, DSA−; CTR) and normal kidneys (NL).