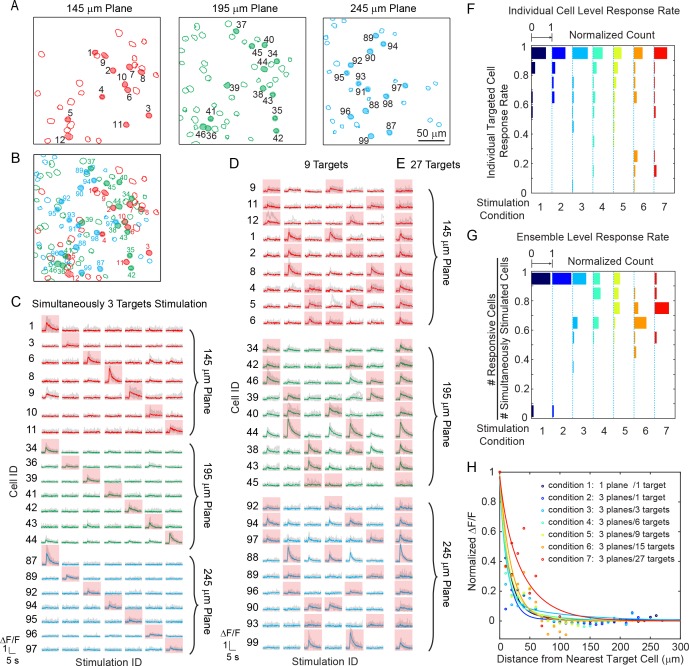
Figure 3. Simultaneous holographic photostimulation of pyramidal cells in vivo.
(A) Contour maps showing the spatial location of the cells in three individual planes in mouse V1 (145 μm, 195 μm, and 245 μm from pial surface). Cells with shaded color are the targeted cells. (B) 2D overlap projection of the three planes in (A). (C)-(E) Representative photostimulation triggered calcium response of the targeted cells (indicated with red shaded background) and non-targeted cells, for different stimulation patterns. A total number of (C) 3, (D) 9, and (E) 27 cells across three planes were simultaneously photostimulated. The average response traces are plotted over those from the individual trials. (F) Histogram of individual targeted cell response rate (averaged across trials) in different stimulation conditions. The stimulation conditions are listed in (H). (G) Histogram of the percentage of responsive cells in a targeted ensemble across all trials in different stimulation conditions. (H) Response of the non-targeted cells to the photostimulation versus distance to their nearest targeted cell. ΔF/F is normalized to the averaged response of the targeted cells. The total number of photostimulation patterns for condition 1 ~ 7 in (F~H) is 34, 26, 12, 8, 6, 2, 1 respectively; and the total trial for each condition is 8 ~ 11. The mice were transfected with GCaMP6s and C1V1-mCherry. The photostimulation power is 4 ~ 5 mW/cell, and duration was 870 ms, 962 ms, and 480 ms for conditions 1, 2, and 3 ~ 7 respectively.


