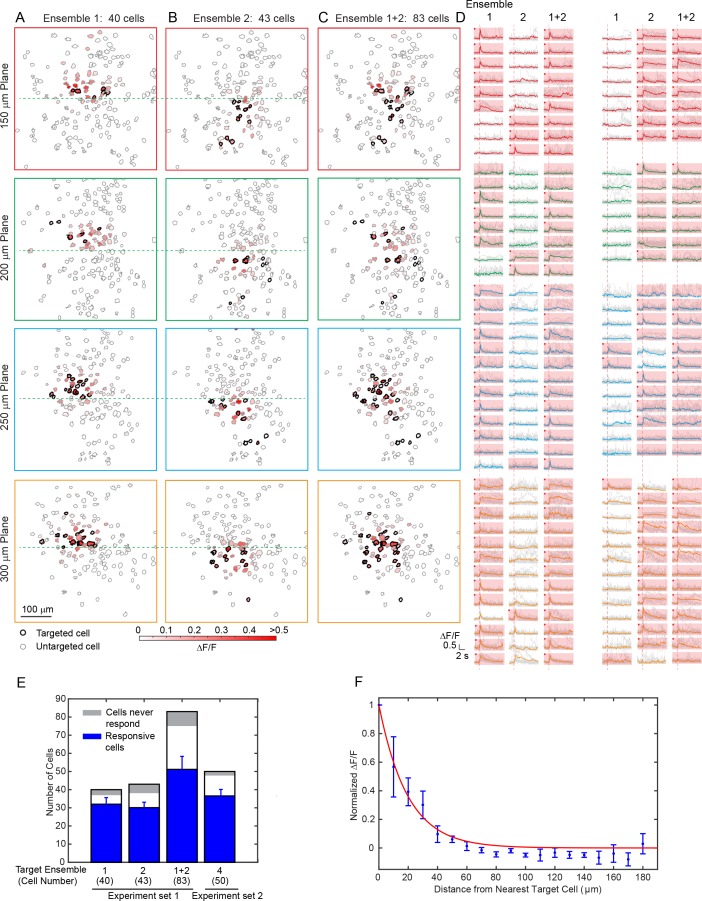
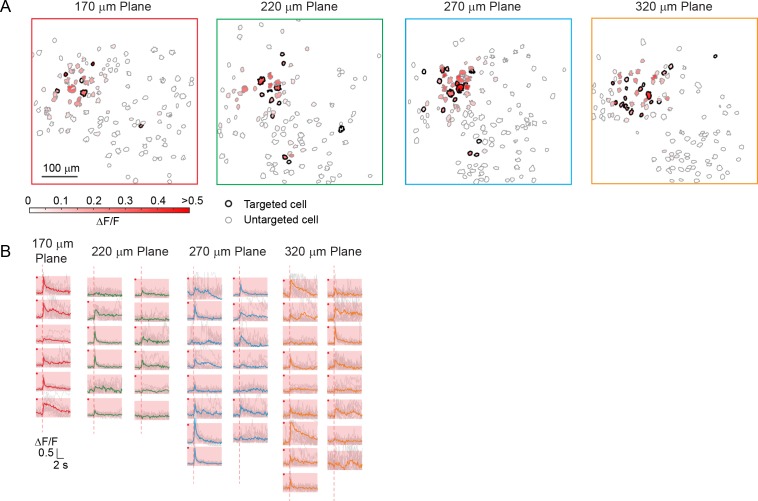
Figure 4. Large scale photostimulation of pyramidal cells in layer 2/3 of V1 in awake mice.
(A~C) Simultaneous photostimulation of 40 cells, 43 cells and 83 cells across four planes in mouse V1 (150 μm, 200 μm, 250 μm and 300 μm from pial surface, with an imaged FOV of 480 × 480 µm2 in each plane.). The contour maps show the spatial location of the cells in individual planes. Cells with black contour are the simultaneously targeted cells. The red shaded color shows the evoked ΔF/F in average. (D) Photostimulation triggered calcium response of the targeted cells (indicated with red shaded background) and non-targeted cells, corresponding to conditions shown in (A~C). The average response traces are plotted over those from a total of 11 individual trials. Those with a red dot indicate cells showing clear evoked calcium transient through manual inspection. (E) Number of target cells, number of total responsive cells across all trials, and cells that did not show any response in any photostimulation pattern, for four different photostimulation conditions. Condition 1 ~ 3 correspond to those in (A~C). Error bars are standard deviation over trials. (F) Response of the non-targeted cells to the photostimulation versus distance to their nearest targeted cell (for conditions shown in E). ΔF/F is normalized to the averaged response of the targeted cells. Error bars are standard error of the mean over different photostimulation conditions in (E). The mice were transfected with GCaMP6f and C1V1-mCherry. The photostimulation power was 3.6 ~ 4.8 mW/cell, and the duration was 94 ms (composing of 5 continuously repeated spiral scans).


