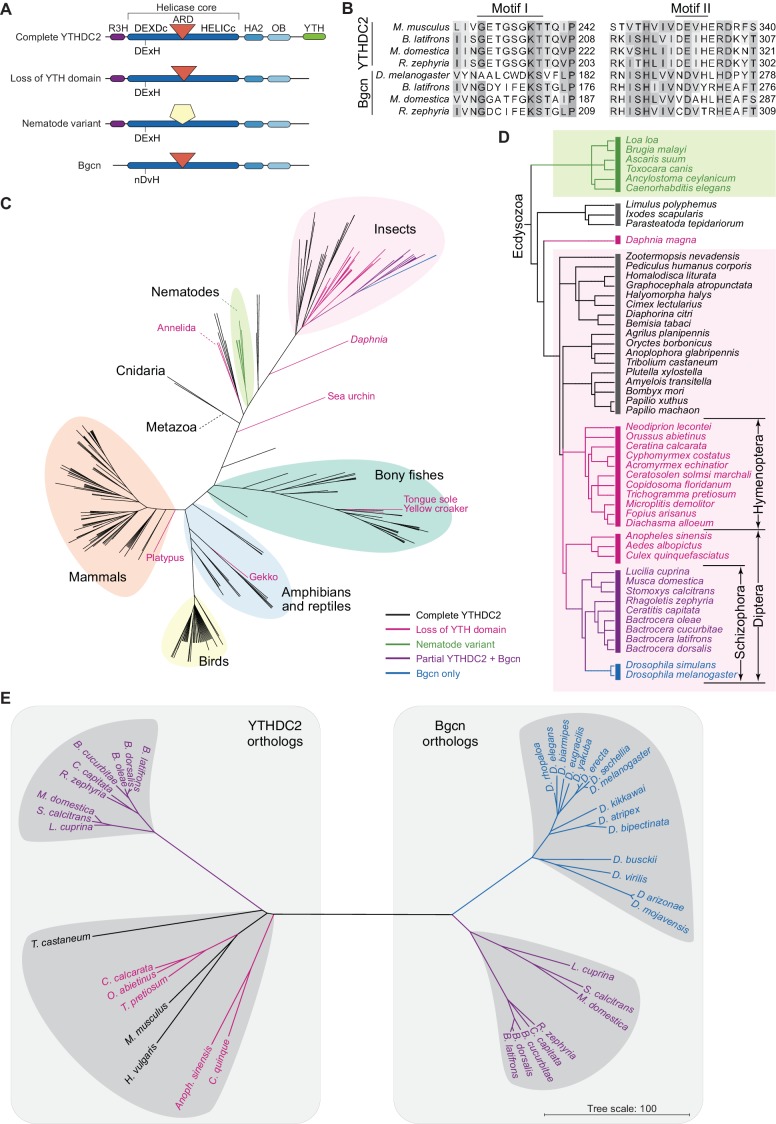
Figure 10. Distribution of YTHDC2 variants in Metazoa.
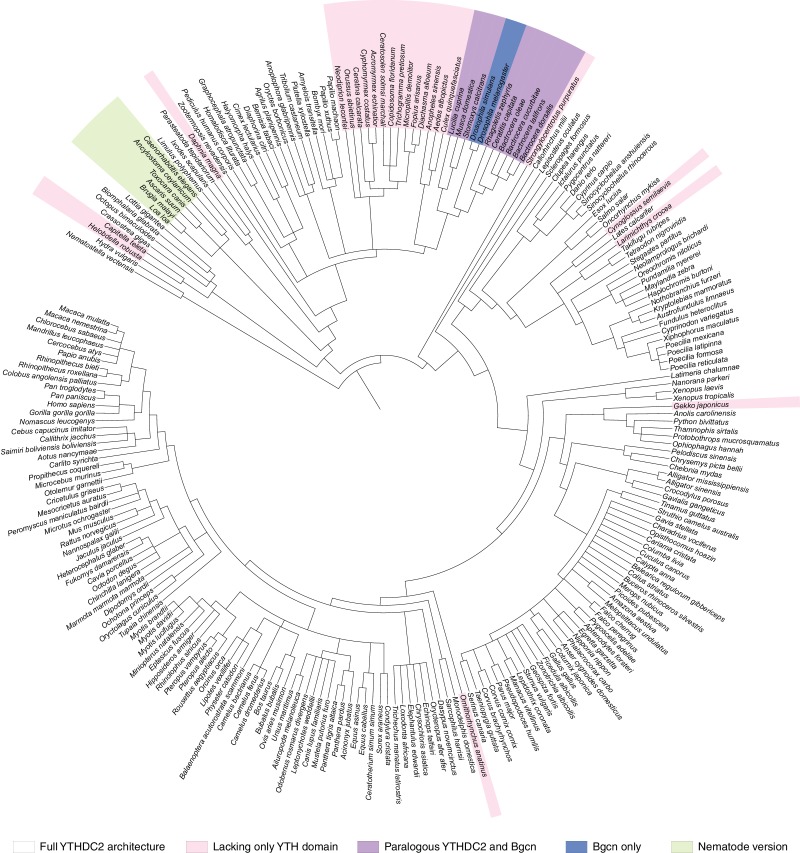
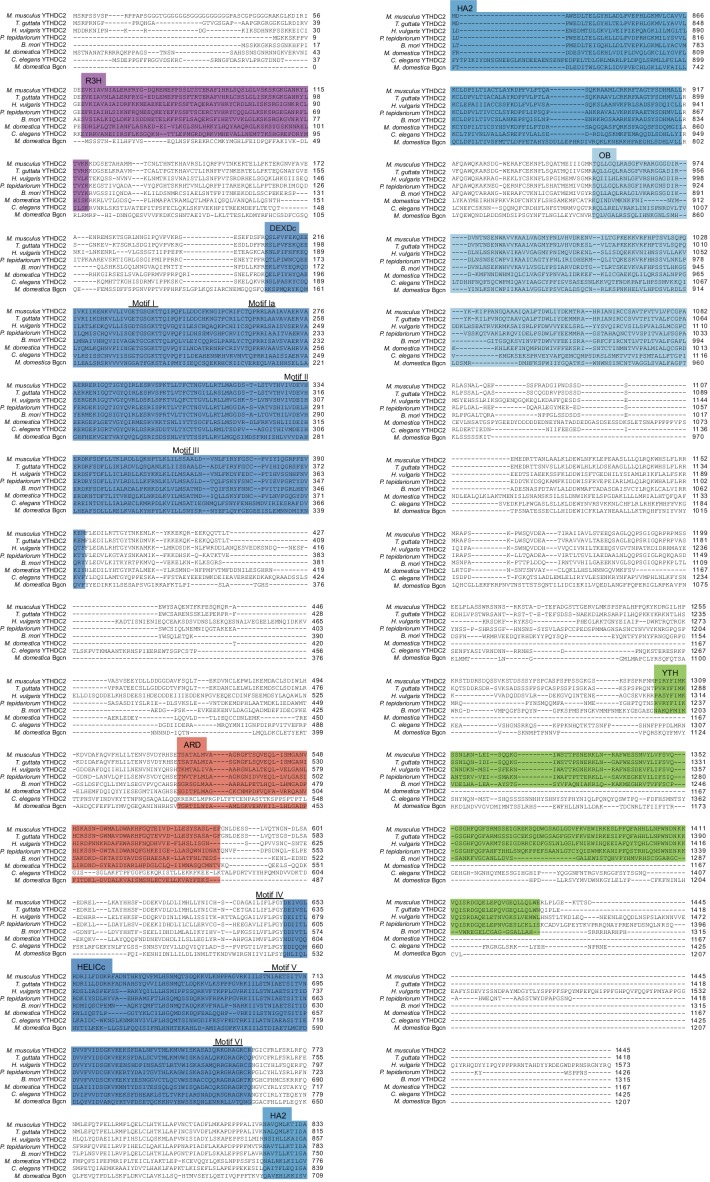
(A) Schematic of domain architectures (not to scale) of metazoan YTHDC2 orthologs and paralogs. (B) Clustal Omega alignment of sequences around helicase motifs I and II for YTHDC2-like and Bgcn-like proteins from schizophoran flies. Mouse YTHDC2 is shown for comparison. Bgcn proteins have amino acid changes that are incompatible with ATPase activity (Ohlstein et al., 2000). (C) Phylogenetic distribution of YTHDC2 in Metazoa. The tree is an unrooted cladogram of NCBI taxonomy for a non-exhaustive collection of 234 species in which at least one close YTHDC2 homolog was identified. Tree leaves are color coded according to YTHDC2 domain architecture. The same tree topology is reproduced in Figure 10—figure supplement 1 with complete species names. (D) Distribution of YTHDC2 variants in Ecdysozoa. The rooted cladogram shows NCBI taxonomy for the ecdysozoan portion of the metazoan tree in panel C. Background shading and color-coding of tree leaves is the same as in panel C. (E) Phylogram for sequence alignments of complete YTHDC2 and Bgcn orthologs from the indicated species. Note that protein sequence distances are similar within the YTHDC2 and Bgcn subfamily trees, but species in the YTHDC2 tree span much greater evolutionary distances. Sequences were aligned with Clustal Omega and the unrooted neighbor-joining tree was constructed from distances calculated using the scoredist function (Sonnhammer and Hollich, 2005). Tree leaves are color coded by YTHDC2 protein domain architecture as in panel C. Protein accession numbers are in Supplementary file 3.


