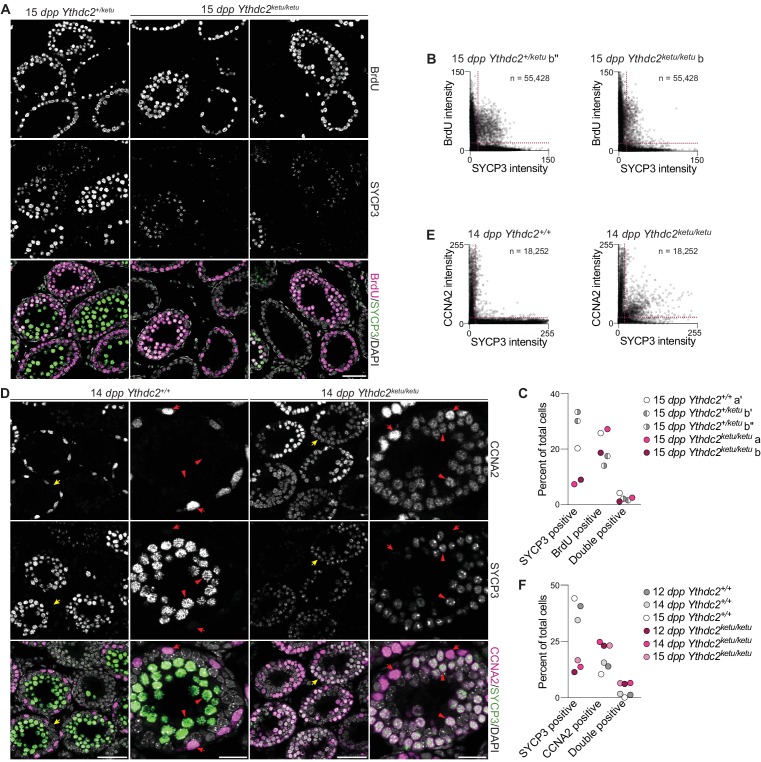
Figure 5. Mixed mitotic and meiotic characteristics of Ythdc2ketu/ketu spermatocytes.
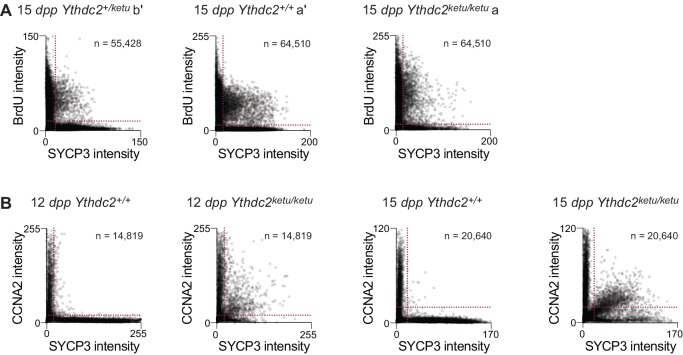
(A) BrdU and SYCP3 immunofluorescence on testis sections from 15-dpp Ythdc2ketu/ketu and heterozygous littermates. Testes were fixed 2 hr after BrdU administration. (B) Scatter-plots showing BrdU and SYCP3 immunofluorescence intensity of testis cells from 15-dpp Ythdc2ketu/ketu (b) and heterozygous (b′′) littermates. Immunostained testis sections were imaged and average fluorescence intensities of individual cells were measured as 8-bit intensity values (0–255 AU). The number of cells scored from each animal is indicated (n) and dotted lines denote intensity thresholds applied for scoring cells as positively stained. (C) Quantification of BrdU and SYCP3 immunofluorescence on testis sections from 15-dpp-old Ythdc2ketu/ketu (a, b) and wild-type or heterozygous (a′, b′, b′′) littermates (same mice analyzed in panel B and Figure 5—figure supplement 1A). Fluorescence intensities were measured as described for panel B and a minimum intensity threshold of 15 AU was applied for scoring cells as positive for staining. (D) CCNA2 and SYCP3 immunofluorescence on testis sections from 14-dpp Ythdc2ketu/ketu and wild-type littermates. Yellow arrows in the lower magnification views (first and third columns) point to tubules of interest, which are shown at a higher magnification in the second and fourth columns. In the higher magnification views, red arrows point to cells with spermatogonia-like morphology and red arrowheads indicate SYCP3-positive spermatocytes. (E) Scatter-plots showing CCNA2 and SYCP3 immunofluorescence intensity of testis cells from 14-dpp Ythdc2ketu/ketu and wild-type littermates. Fluorescence intensities were measured as described for panel B and the number of cells scored from each animal is indicated (n). (F) Quantification of CCNA2 and SYCP3 immunofluorescence on testis sections from Ythdc2ketu/ketu and wild-type littermates of the indicated ages (same mice analyzed in panel E and Figure 5—figure supplement 1B). Fluorescence intensities were measured as described for panel B and a minimum intensity threshold of 20 AU was applied for scoring cells as positive for staining. In panel A, the scale bar represents 50 μm. In panel D, the scale bars represent 50 μm and 20 μm in the lower and higher magnification images, respectively. Raw data for panels B, C, E and F are provided in Figure 5—source data 1, Figure 5—source data 2, Figure 5—source data 3 and Figure 5—source data 4, respectively.


