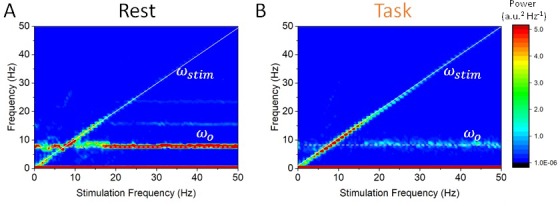
Figure 5. State-dependent responses to periodic stimulation with variable frequency.

(A) Power in the rest state is concentrated at the endogenous frequency (horizontal dashed line at 8 Hz) while the stimulation frequency is increased from 0 to 50 Hz. The peak power found at the stimulation frequency (dashed line along the diagonal) is small unless , that is, when the stimulation frequency is close to the peak alpha frequency. (B) In the task state, power is instead concentrated at the stimulation frequency across the range of values visited (along the diagonal). By contrast, power at the endogenous oscillation is much smaller. Note that the power at the stimulation frequency scales with the distance with respect to the alpha peak at 8 Hz. Stimulation parameters here are 0.15 while was varied from 0 to 50 Hz.
