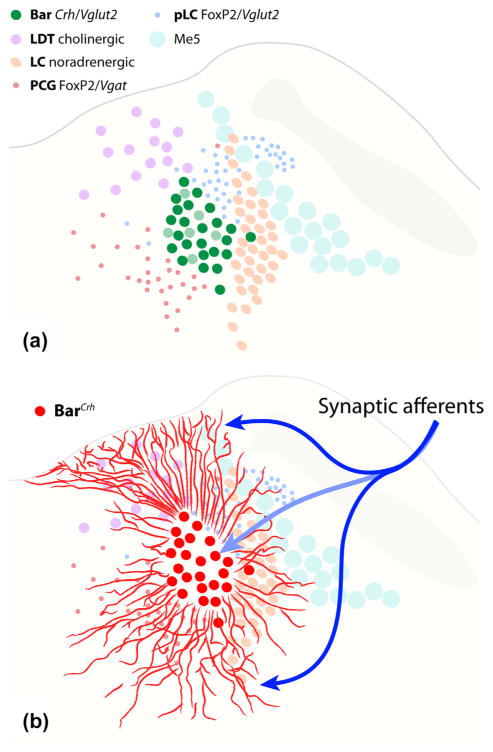
FIGURE 11.
Summary drawings of the mouse pontine tegmentum show (a) the relative distributions of neurons in Bar and five surrounding populations and (b) the unexpectedly large territory covered by dendritic processes emerging from BarCRH neurons (as in Figure 8). These long dendrites may receive a broader range of synaptic (input) connections than those identified in previous tracing studies targeting the somatic core. The neuron populations abbreviated in the legend (a) are detailed in the text and figures above

