. 2018 Mar 1;7(1):A0065. doi: 10.5702/massspectrometry.A0065

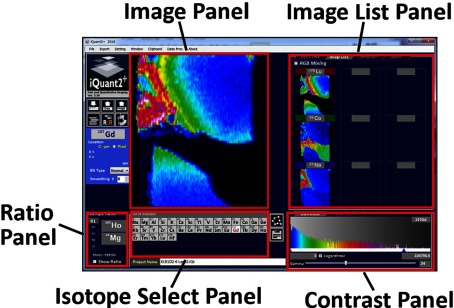
Fig. 2. The main window of iQuant2, which consists of several panels. The false color image is shown on the Image Panel, and the exhibiting isotope can be changed by the Isotope Select Panel. Other isotope images can be listed on the Image List Panel. This panel can be switched to the Bird’s Eye View Panel, the Correlation Panel, and the Quantitative Analysis Panel. Contrast adjustment can be performed by the Contrast Panel, which can be switched to the Line Profile Panel.

Fig. 2. The main window of iQuant2, which consists of several panels. The false color image is shown on the Image Panel, and the exhibiting isotope can be changed by the Isotope Select Panel. Other isotope images can be listed on the Image List Panel. This panel can be switched to the Bird’s Eye View Panel, the Correlation Panel, and the Quantitative Analysis Panel. Contrast adjustment can be performed by the Contrast Panel, which can be switched to the Line Profile Panel.